

Bitcoin (BTC), Ethereum (ETH) Price Analysis:
- Bitcoin prices snap back after the major cryptocurrency climbed to a fresh-four month high earlier this week.
- BTC/USD weighed down by technical support and resistance around the key psychological level of $21,000.
- Ethereum (ETH) dips below $1600 before stalling at $1550.

Bitcoin prices have fallen back into a narrow range of support and resistance, forming around the key psychological level of $21000. After experiencing a strong start to 2023, major cryptocurrencies have snapped back from their recent rally that has been driving price action over the past two-weeks.
With BTC/USD retreating from a four-month high of $21646 earlier this week, Ethereum (ETH) has experienced marginal losses, falling below $1600.
Bitcoin (BTC/USD) Technical Analysis
After a temporary breach of the November 2022 high of $21473, Bitcoin prices rose modestly before reaching a fresh four month high of $21646. Although a shift in sentiment and an increase in bullish momentum triggered the recovery, technical levels have provided an additional catalyst for price action.

On the weekly chart below, a clear break of prior resistance at $17792 facilitated the rally that drove prices 22% higher last week. As last week’s move is represented by a long, full-bodied candle, the formation of a low-bodied candle this week suggests that bulls may be losing steam.
With the tip of the candlestick wick appearing slightly above the Nov high, failure to gain traction above $21600 has placed additional pressure on the upside move.
Bitcoin (BTC) Weekly Chart
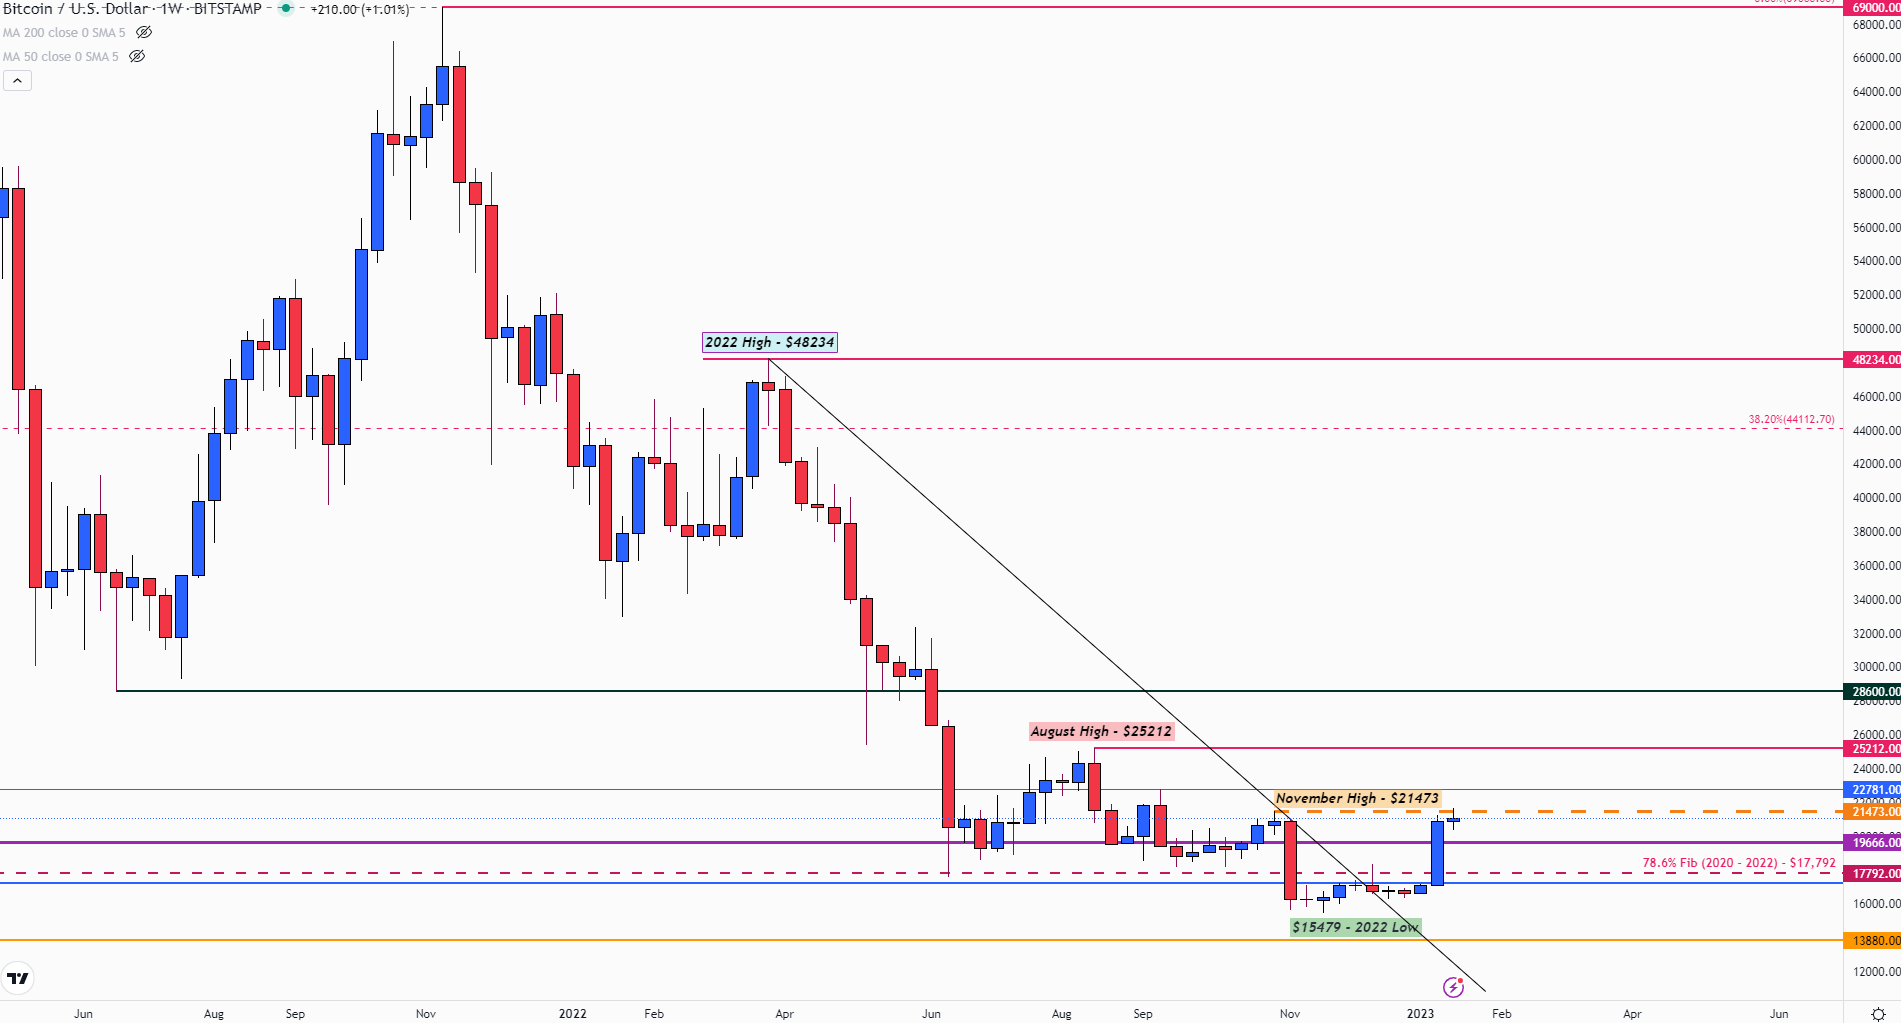
Chart prepared by Tammy Da Costa using TradingView
From a short-term standpoint, BTC/USD is trading above psychological support currently holding at $21000. While the current daily candle struggles to determine a clear directional bias, upside gains have appeared to be limited. With the 14.4% Fibonacci retracement of the 2022 move providing support at $20195, a break below could see prices falling back towards the 2017 high of $19666.
Bitcoin (BTC/USD) Daily Chart
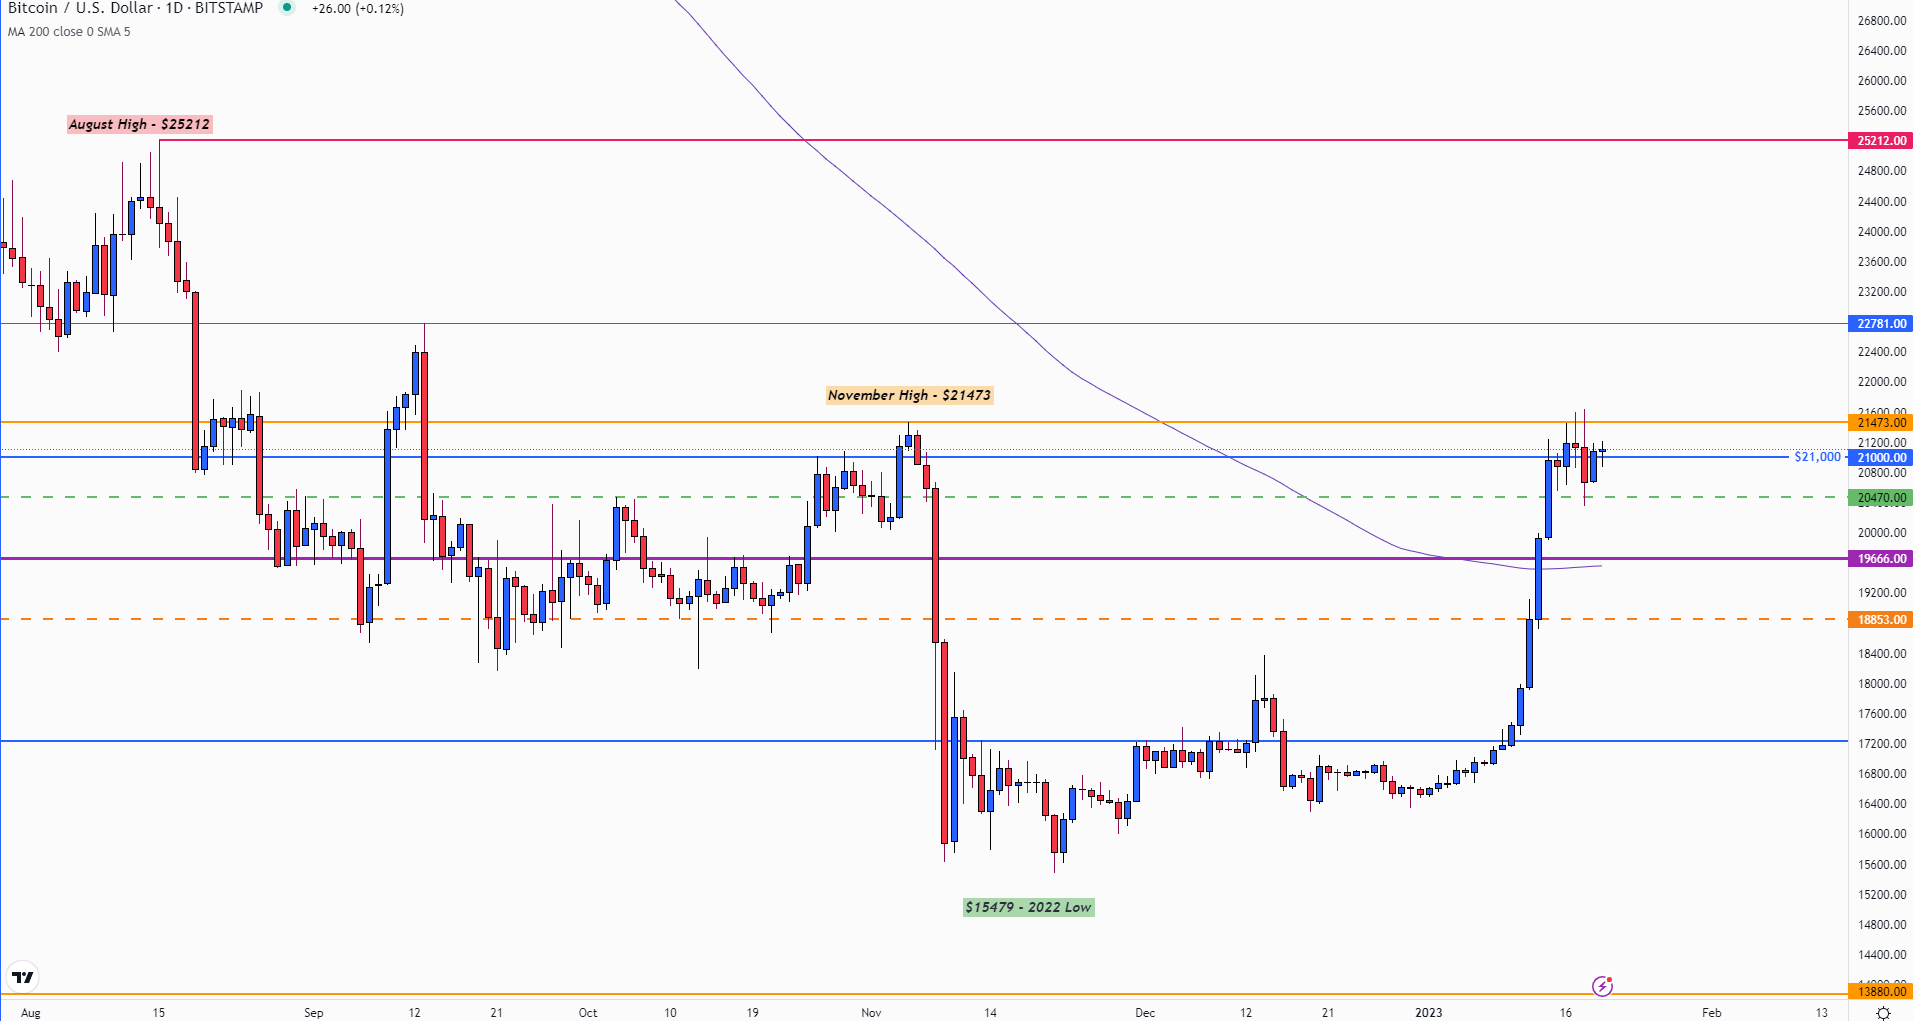
Chart prepared by Tammy Da Costa using TradingView
Meanwhile, as Bitcoin prices remain above the 200-day MA (moving average) at $19557, a retest of $21600 and above $22000 could allow for bullish continuation towards the September 2022 high of $22781.
Ethereum (ETH/USD) Technical Analysis
ETH/USD Daily Chart
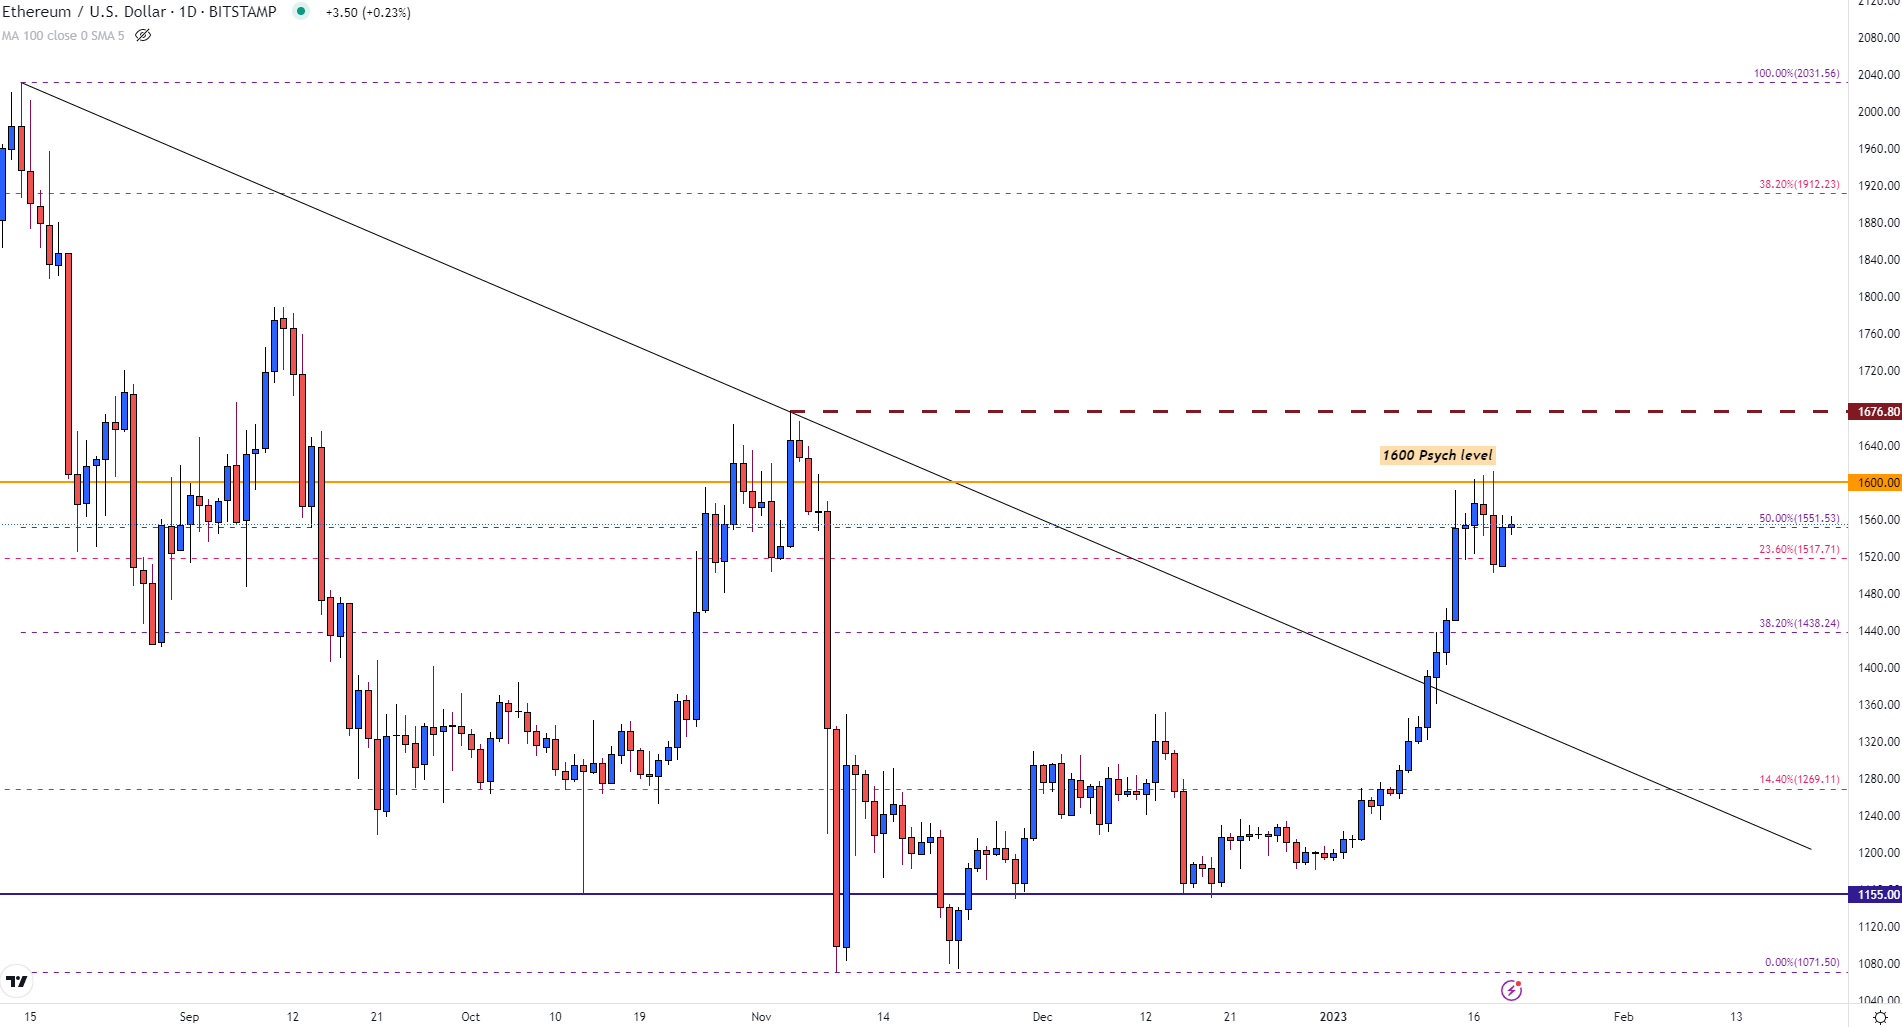
Chart prepared by Tammy Da Costa using TradingView
After peaking at $1611, the second largest cryptocurrency (Ethereum) fell back below $1600 before stabilizing around the mid-point of the August - November move at $1551. With a break of the 23.6% Fibonacci of the 2022 move at $1517 drawing attention to $1500, the downside could gain traction if prices retest this zone.
--- Written by Tammy Da Costa, Analyst for DailyFX.com
Contact and follow Tammy on Twitter: @Tams707