


US Dollar Price Action Setups
- The US Dollar finds itself in a familiar spot of support.
- This Friday brings Non-Farm Payrolls and two weeks from now brings an FOMC rate decision.
- The analysis contained in article relies on price action and chart formations. To learn more about price action or chart patterns, check out our DailyFX Education section.
We’re now two weeks away from the next FOMC rate decision. And this is a big one, too, as it’s a quarterly meeting that’ll also bring in an updated Summary of Economic Projections. The dot plot matrix contained within those projections has been a large point of contention lately as market participants try to gauge when the Fed might actually begin to pare back pandemic policy. We’ve already heard from the Bank of Canada on that front, and with the BoC being one of the few major Central Banks to open the door to policy normalization, USD/CAD has continued to sink since the bank made that announcement.
A lot has happened since that last FOMC rate decision in April. The NFP report in early-May was abysmally bad. But, on the other hand, the inflation print released early in May was very aggressive, printing at 4.2% annualized, a level that Vice Chair Richard Clarida remarked on later in the month, saying he was ‘surprised.’
And this begs the question – is the Fed still seeing inflation as transitory and little to worry about? We’ll find out in two weeks at the FOMC rate decision when the bank unveils that updated dot plot matrix.
Until then, there’s potential for pullback in USD. The first two months of Q2 have seen a clean bearish trend in the Greenback. But, the USD is getting caught in the same zone of support that helped to stem the lows in early-Q1, around the 90 level on DXY which is confluent with a long-term Fibonacci level at 89.92.
US Dollar Monthly Price Chart
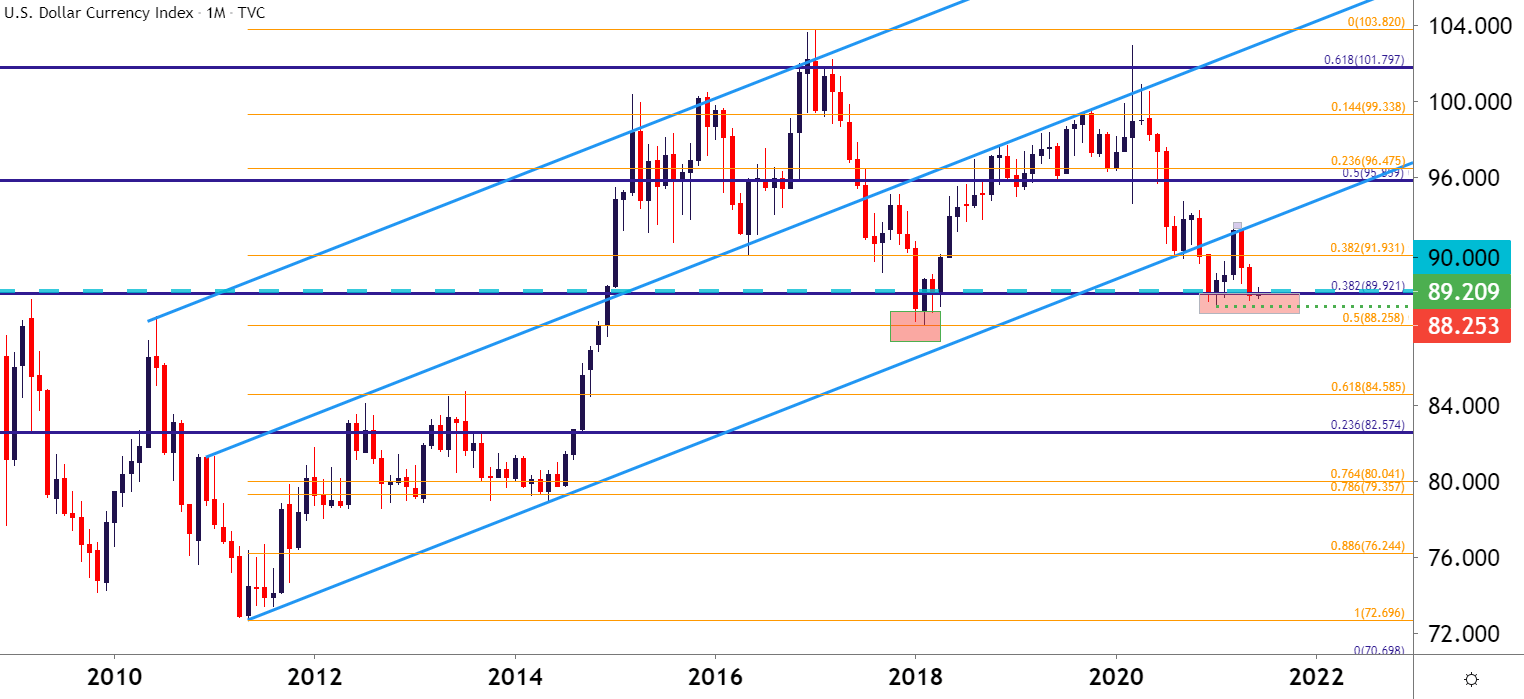
Chart prepared by James Stanley; USD, DXY on Tradingview
On a shorter-term basis, there’s also a technical reason that could produce a pullback, and that’s the same thing that showed up in the US Dollar in early-Q1 trade, just before buyers made their mark.
The falling wedge formation is often approached with the aim of bullish reversals. It’s marked by a more aggressive trendline at highs or resistance than what’s showing at support. In Q1, this led into a strong pullback. More recently, buyers have started to push price out of the upper-bound of the formation, highlighting bullish potential in the coming days.
To learn more about the falling wedge formation, check out DailyFX Education
US Dollar Four-Hour Price Chart
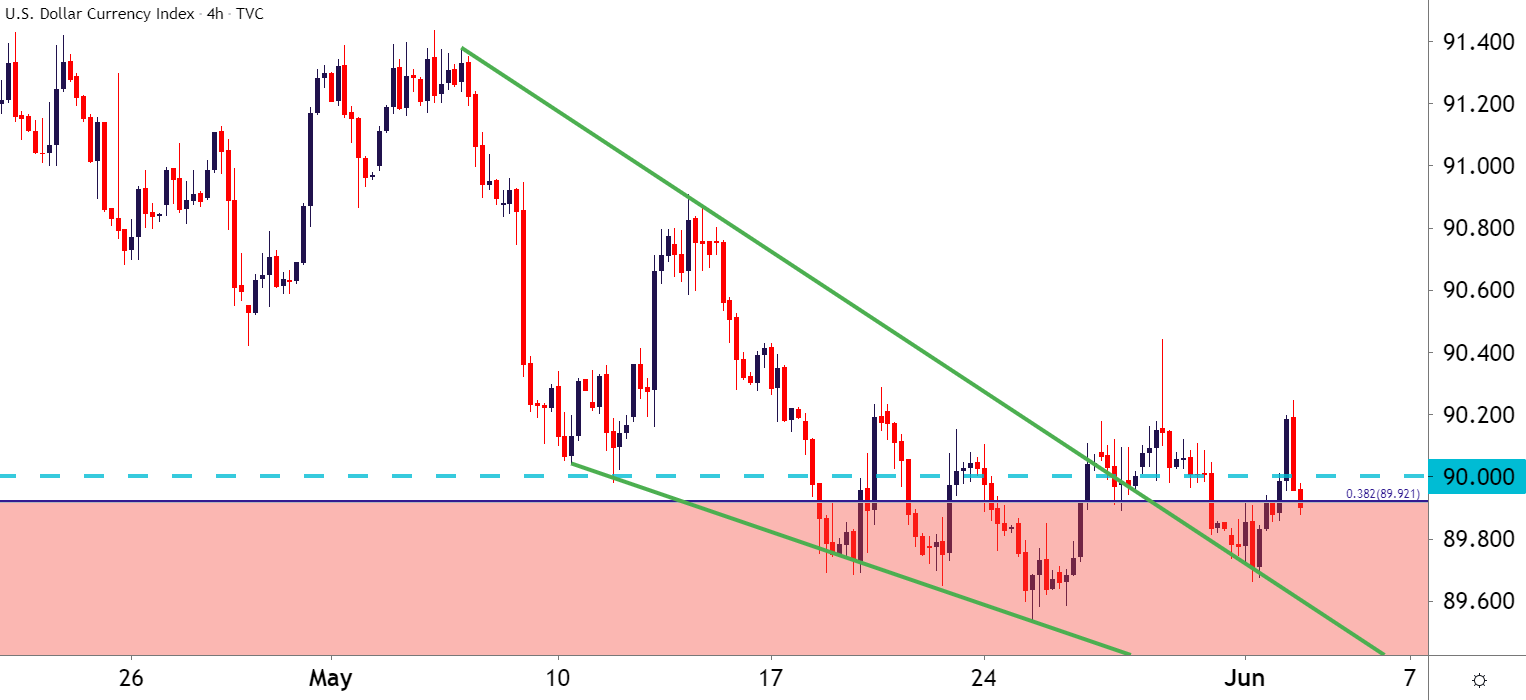
Chart prepared by James Stanley; USD, DXY on Tradingview
EUR/USD: Ranges Near Resistance
EUR/USD has put in a strong start to Q2 trade. But, as the US Dollar digs into support, EUR/USD has done the same at resistance. As shared in the webinar, given the prior trend leading into the range, I’d still focus on treating the range with a trend-side bias in the pair. Or, perhaps, look to take that Euro strength in another direction, such as with EUR/JPY.
EUR/USD Four-Hour Price Chart
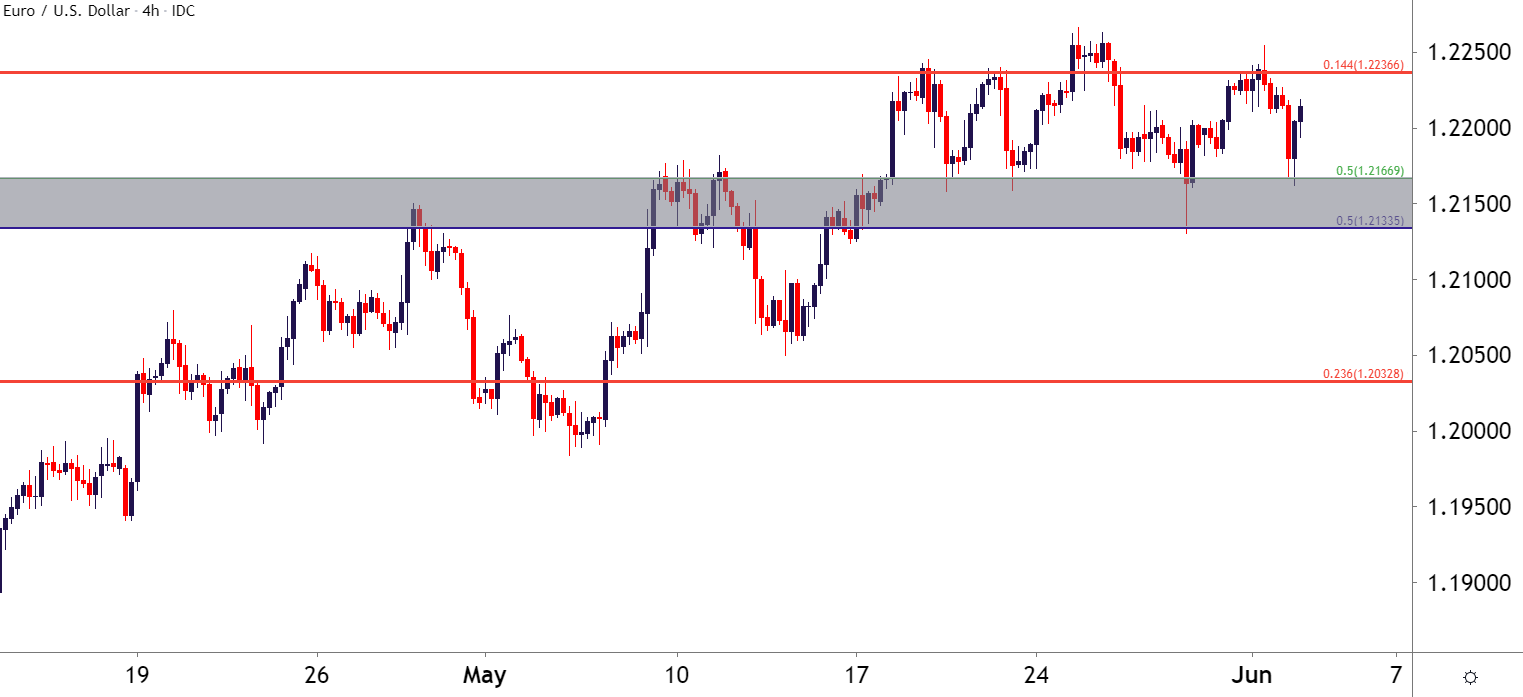
Chart prepared by James Stanley; EURUSD on Tradingview
EUR/JPY
An alternative approach on Euro strength could be EUR/JPY, which has put in seven consecutive weeks of gains.
EUR/JPY Daily Price Chart

Chart prepared by James Stanley; EURJPY on Tradingview
GBP/USD Sets Fresh High and then Pulls Back
Similar to the Euro above, the British Pound has been really strong of recent; and when meshed up with a weak US Dollar, this has allowed for a fresh three-year-high to be set in the pair earlier this morning. But, also similar to EUR/USD above, a primary complication would appear to be the US Dollar. If the Greenback is due a pullback, the bullish trend in Cable could similarly face pullback. And, like the above, there’s an alternative option which I’ll look at after this chart.
GBP/USD Four-Hour Price Chart
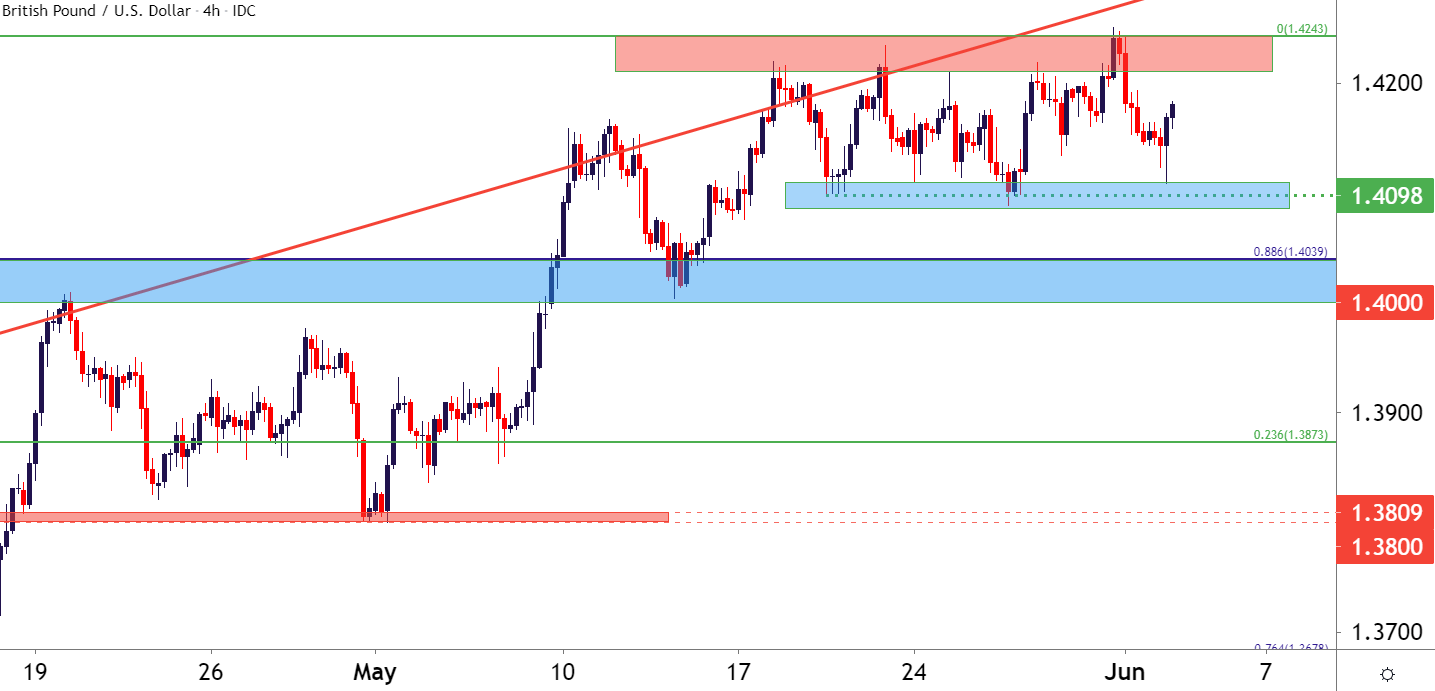
Chart prepared by James Stanley; GBPUSD on Tradingview
GBP/JPY Fresh High, 155 Support Test
Similar to the scenario looked at above around the Euro, GBP/JPY may be an option for GBP bulls that are looking to avoid the US Dollar. Similarly, the trend in GBP/JPY has been running higher for a while now, but short-term dynamics have continued to keep the door open for buyers, most recently of which was a pullback to and support test at the 155 psychological level.
GBP/JPY Daily Price Chart
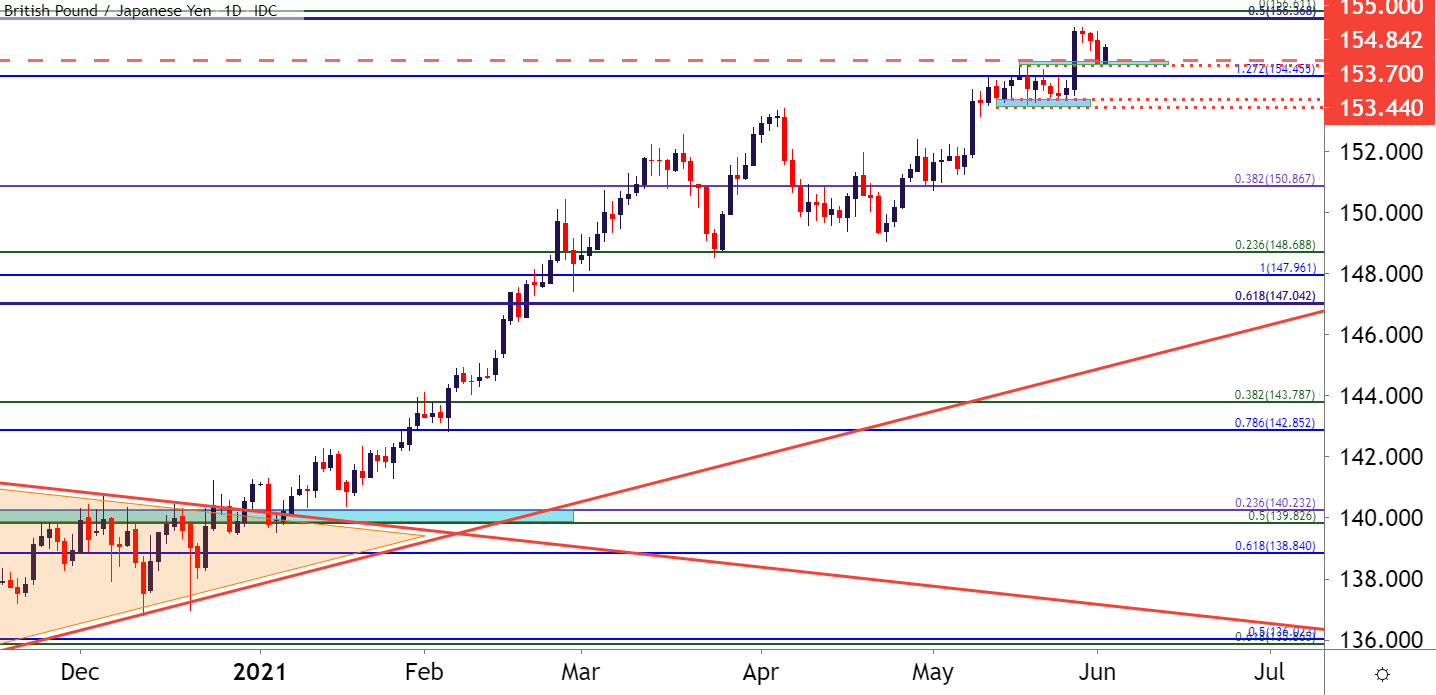
Chart prepared by James Stanley; GBPJPY on Tradingview
USD/CAD Stops Short of 1.2000
An excellent example of a psychological level coming into play without actually coming into play shows in USD/CAD. I had looked into the matter last week, cautious of a seller breach around the 1.2000 big figure; instead, looking for a wiggle up to resistance. Well, the resistance test happened but the psychological level still hasn’t given way, with sellers pulling up short by a mere 2 pips.
This is a pretty visible example of sellers slowing their aggression as a major level of potential support was coming into the picture. That’s since led into a bounce in USD/CAD. The possibility of bearish trend resumption seems very attractive: The complication at this point is the technical backdrop and the inability of sellers to yet test or take-out the 1.2000 level.
To learn more about psychological levels, check out DailyFX Education
USD/CAD Four-Hour Price Chart
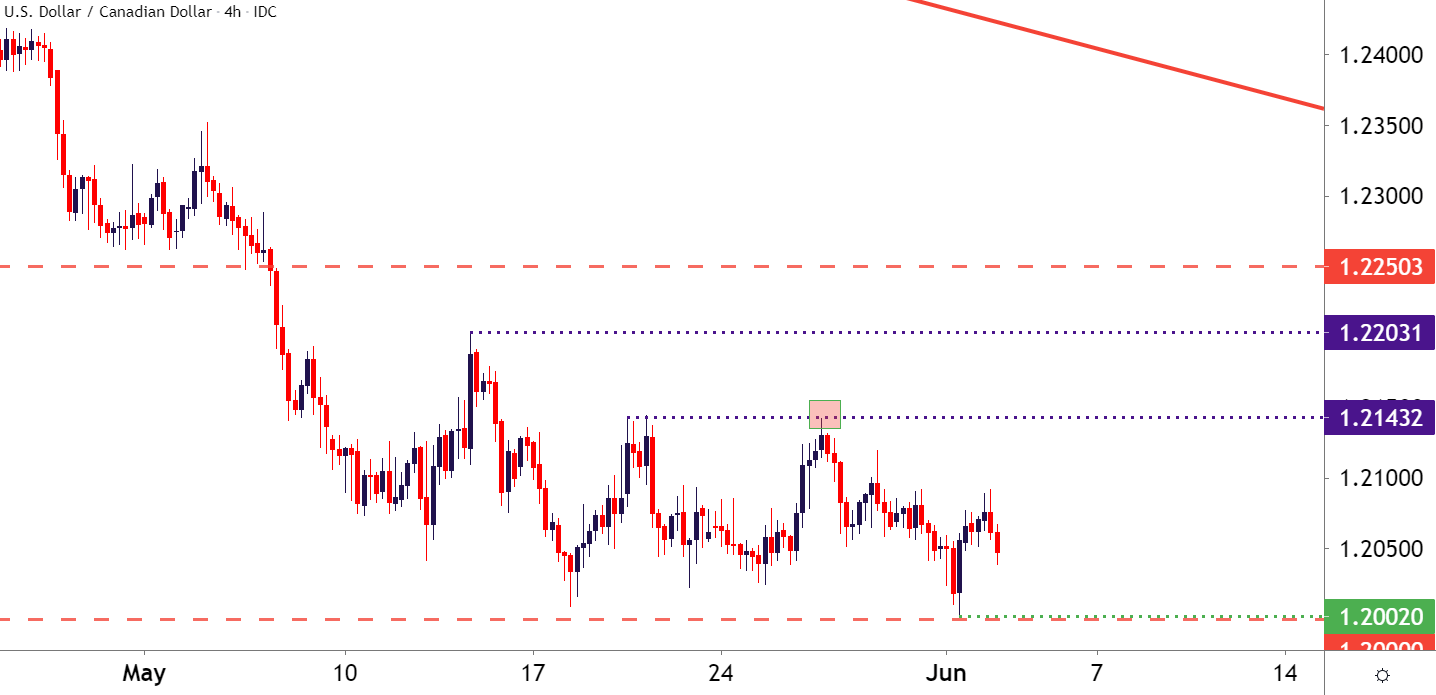
Chart prepared by James Stanley; USDCAD on Tradingview
USD/JPY Threatens Breakout
One of the few majors that may be attractive for USD-strength is USD/JPY. The pair put in a strong Q1, largely on the basis of the rates trade; but as we get closer to the June FOMC rate decision, perhaps there’s a bit of pre-positioning going on here in case the Fed warns of a 2022 rate hike?
But, USD/JPY is set up with bullish breakout potential, with resistance showing from around 109.87-110.00. The topside potential in this pair also explains why EUR/JPY and GBP/JPY may be more attractive options for Euro and Sterling bulls than EUR/USD and GBP/USD.
USD/JPY Four-Hour Price Chart
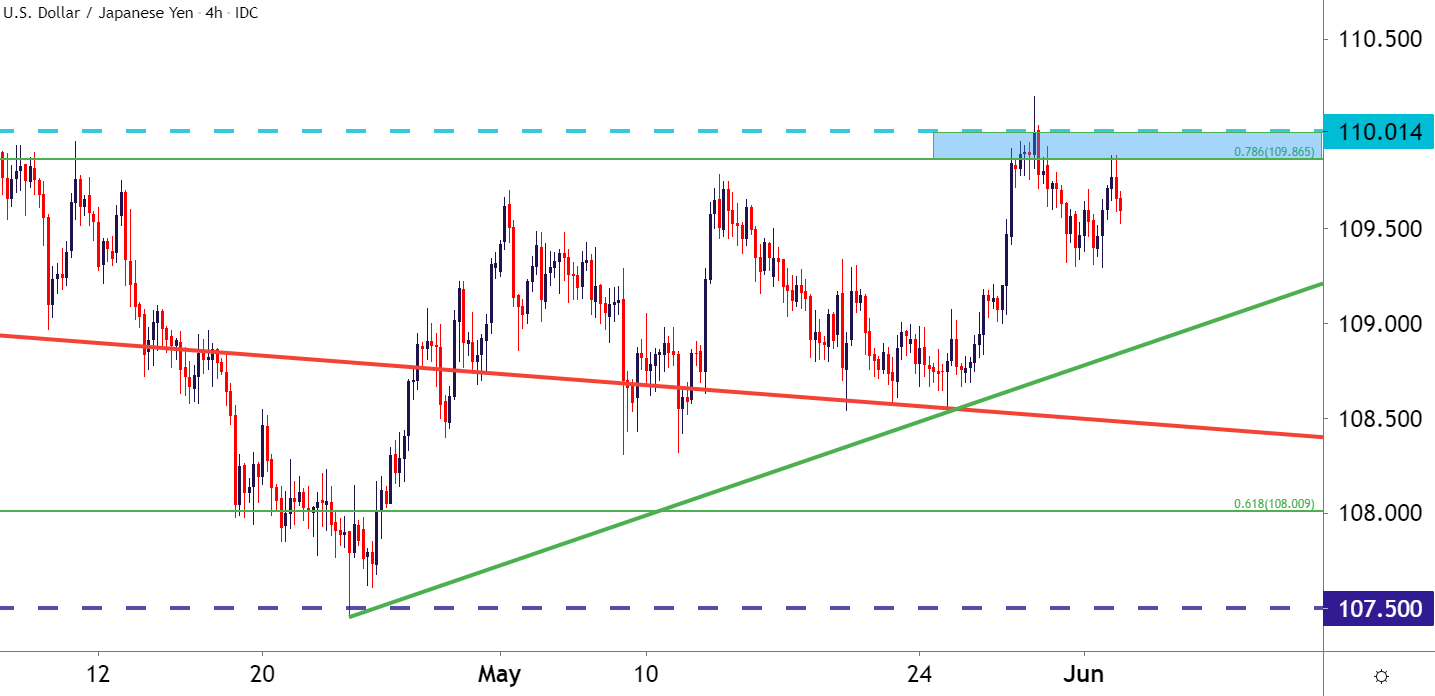
Chart prepared by James Stanley; USDJPY on Tradingview
--- Written by James Stanley, Senior Strategist for DailyFX.com
Contact and follow James on Twitter: @JStanleyFX


