


US Dollar, EUR/USD, GBP/USD, USD/CAD, USD/JPY Price Analysis
- This webinar looked across the macro landscape, focusing in on FX pairs around the US Dollar.
- EUR/USD and GBP/USD have both put in visceral resistance reactions.
- USD/CAD has continued to breakout while USD/JPY has bounced from a key level of longer-term support.
US Dollar in the Spotlight as Global Markets Remain On Edge
Global markets remain on edge as Coronavirus worries permeate the global economy; and the big question now is how global governments might respond to the growing threat. Prior examples in China, Iran and Italy leave little to be excited about as continued spread in each of those countries entailed shutdowns which significantly hampered each economy.
Already in the US a growing concern around continued spread has hit a number of markets; and there’s likely to be some collateral effects in the coming days as the sell-off in Oil is likely to entangle a number of market participants, including possibly a portion of the banking sector.
The wide expectation appears to be for the Fed to try to head-off these risks with extremely loose monetary policy. The US Dollar has put in a sizable sell-off over the past few weeks, finally finding some support yesterday around the 95.00 level on DXY, just after setting a fresh yearly low.
US Dollar Daily Price Chart
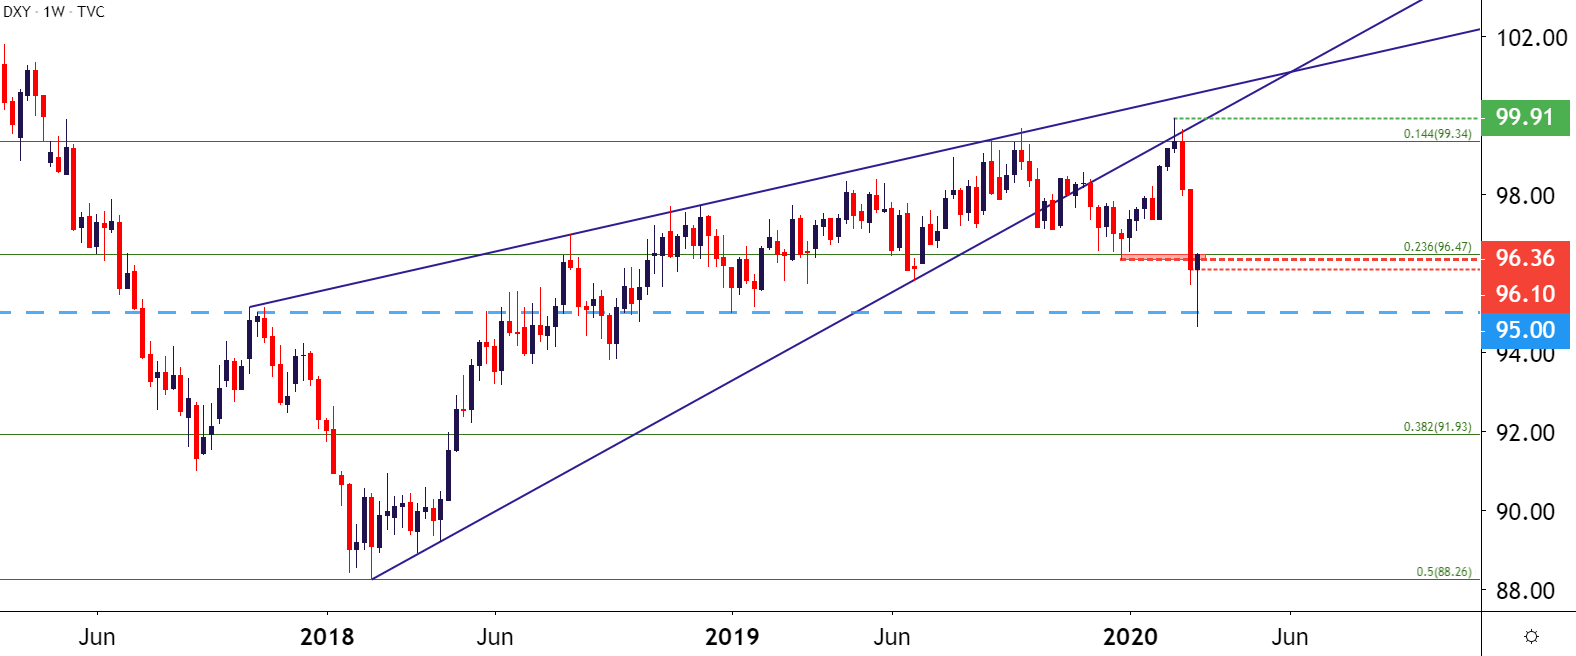
Already the US Dollar has jumped up to test resistance at a key zone on the chart, and that was looked at earlier this morning in the article entitled, US Dollar Price Analysis: USD Bounces From Yearly Lows.
US Dollar Four-Hour Price Chart

USD on Tradingview
EUR/USD Caught From Resistance
EUR/USD finally ran into a resistance area that could bring some sellers into play, and this takes place in the zone that runs from 1.1448-1.1500. The former of those prices is the 50% marker of the 2017-2018 major move.
| Change in | Longs | Shorts | OI |
| Daily | 1% | -5% | -2% |
| Weekly | 9% | 5% | 7% |
EUR/USD Weekly Price Chart

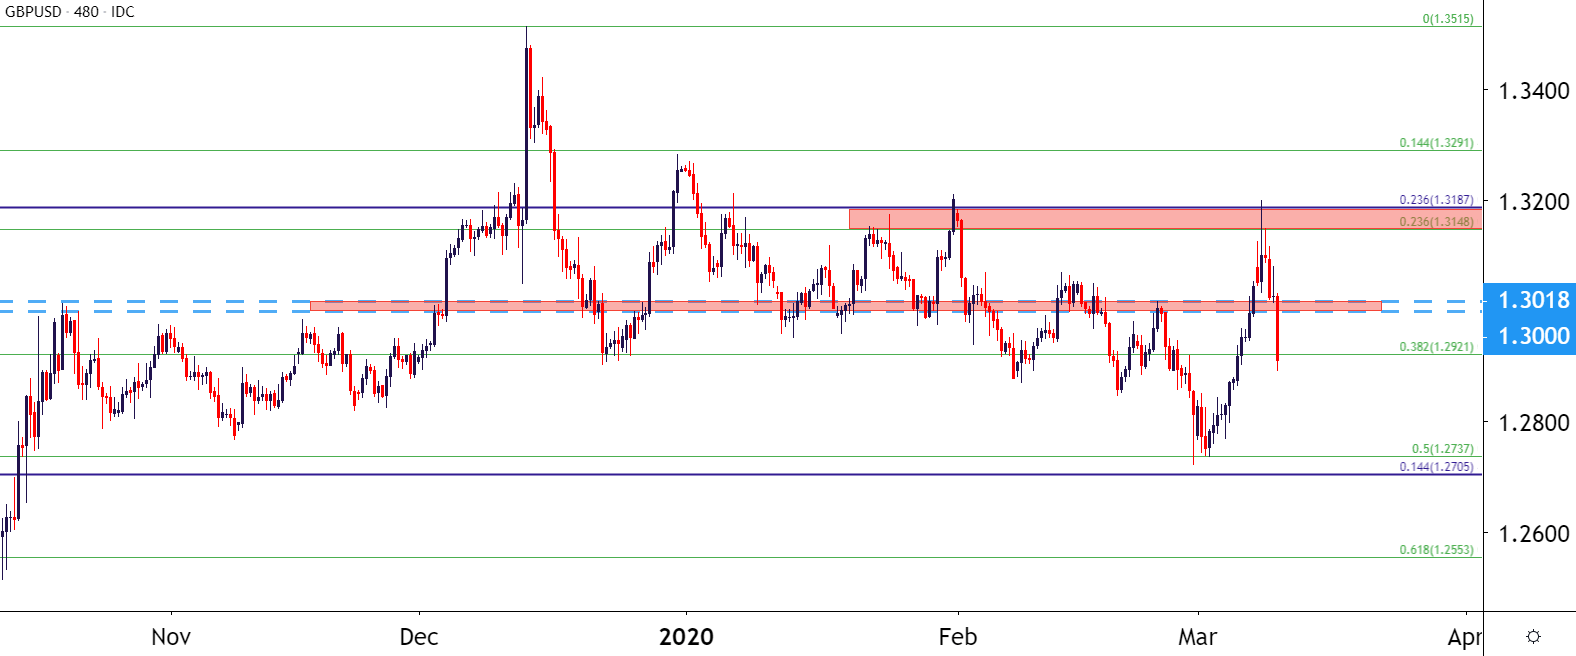
GBP/USD Slides from Resistance
I had looked into Cable yesterday as the GBP/USD pair re-tested a key zone of resistance. Sellers have since made a re-appearance and price action has pushed back below the 1.3000 handle. With the move so extended, bearish continuation approaches could look to a re-test of resistance in the area that runs from the approximate 1.3000-1.3018.
| Change in | Longs | Shorts | OI |
| Daily | -6% | 6% | -1% |
| Weekly | 13% | 4% | 9% |
GBP/USD Eight-Hour Price Chart
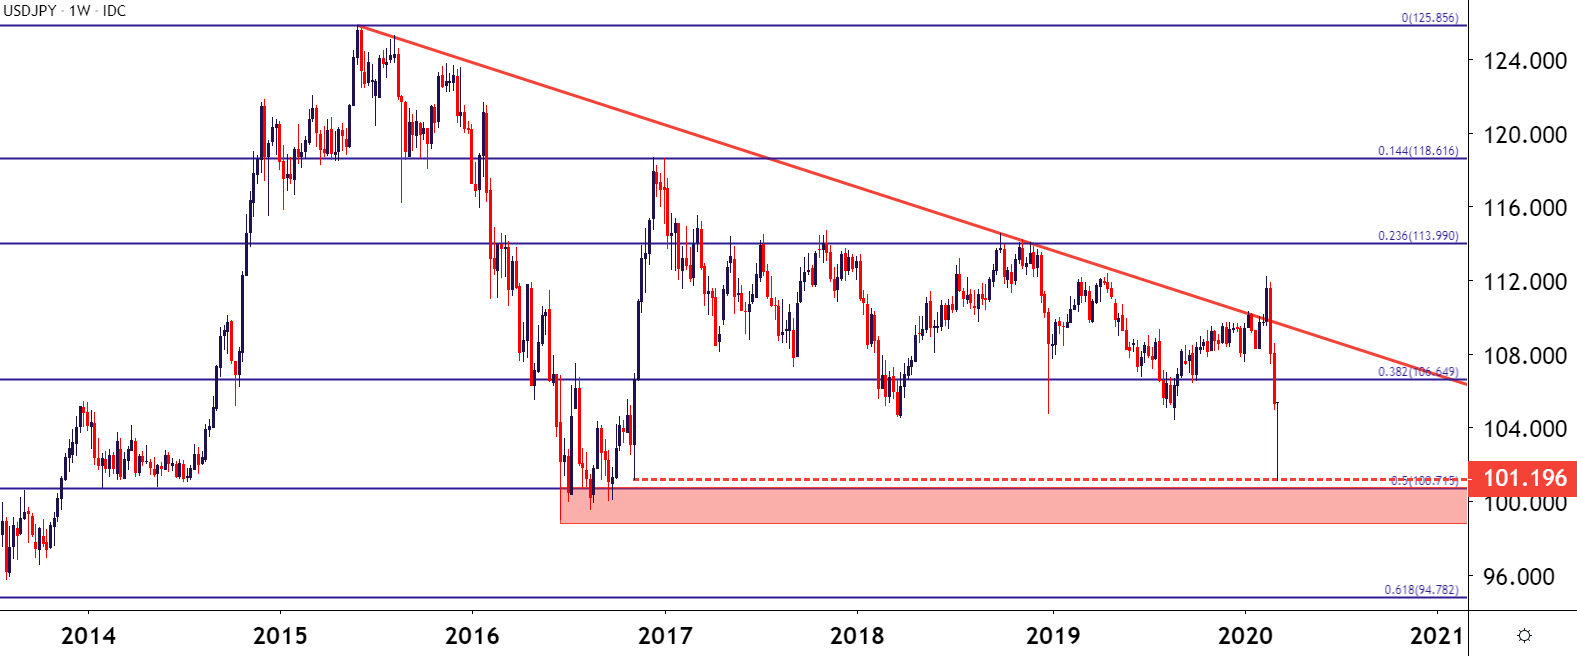
USD/JPY Jumps From Support
I had also looked into USD/JPY in yesterday’s US Dollar Price Action piece, focusing in on an area of support from 2016 that came back into play on Monday to help hold the lows. Buyers have since pushed the bid back towards the 105.00 psychological level, amounting for a huge run over a day-plus stretch.
| Change in | Longs | Shorts | OI |
| Daily | -6% | 0% | -2% |
| Weekly | -11% | 12% | 5% |
USD/JPY Weekly Price Chart
USD/CAD Sets Fresh Four-Year-High
I had written about USD/CAD earlier yesterday, focusing in on the bullish theme that’s remained so aggressive in the pair over the past couple of weeks. This takes place even as the US Dollar has been in a bearish trend, highlight just how incredibly weak the Canadian Dollar has been.
| Change in | Longs | Shorts | OI |
| Daily | 20% | -12% | 2% |
| Weekly | 14% | 2% | 8% |
Since that article was published, the pair has went on to craft a fresh four-year-high, barely breaching the May 2017 swing high before buyers pulled back on the throttle.
USD/CAD Weekly Price Chart

--- Written by James Stanley, Strategist for DailyFX.com
Contact and follow James on Twitter: @JStanleyFX


