


US Dollar, USD Price Analysis
- The US Dollar has been hit hard during this recent round of risk aversion.
- The likely driver in USD has been the re-pricing of carry trades as expectations for FOMC softening have continued to build.
- The US Dollar went from fresh three-year-highs just a few weeks ago to fresh yearly lows set yesterday.
US Dollar, From Highs to Lows
The US Dollar has put in a stunning reversal over the past few weeks as the world wrestles with a brand new risk factor. After the Greenback pushed up to fresh three-year-highs just a few weeks ago, concerns around Coronavirus began to permeate global markets and in short-order risk markets were selling off. As those sell-offs picked up speed, expectation for more aggressive FOMC softening entered the equation, helping to push the US Dollar lower as carry trades got further priced-out of the market. As that worry has continued to grow, along with expectations for the Fed to continue cutting rates in an emergency backdrop in the effort of shoring up the US economy against a wider spread of the virus, the US Dollar has only continued to fall through this week’s open, finally finding support around the 95.00 level on DXY.
US Dollar Weekly Price Chart
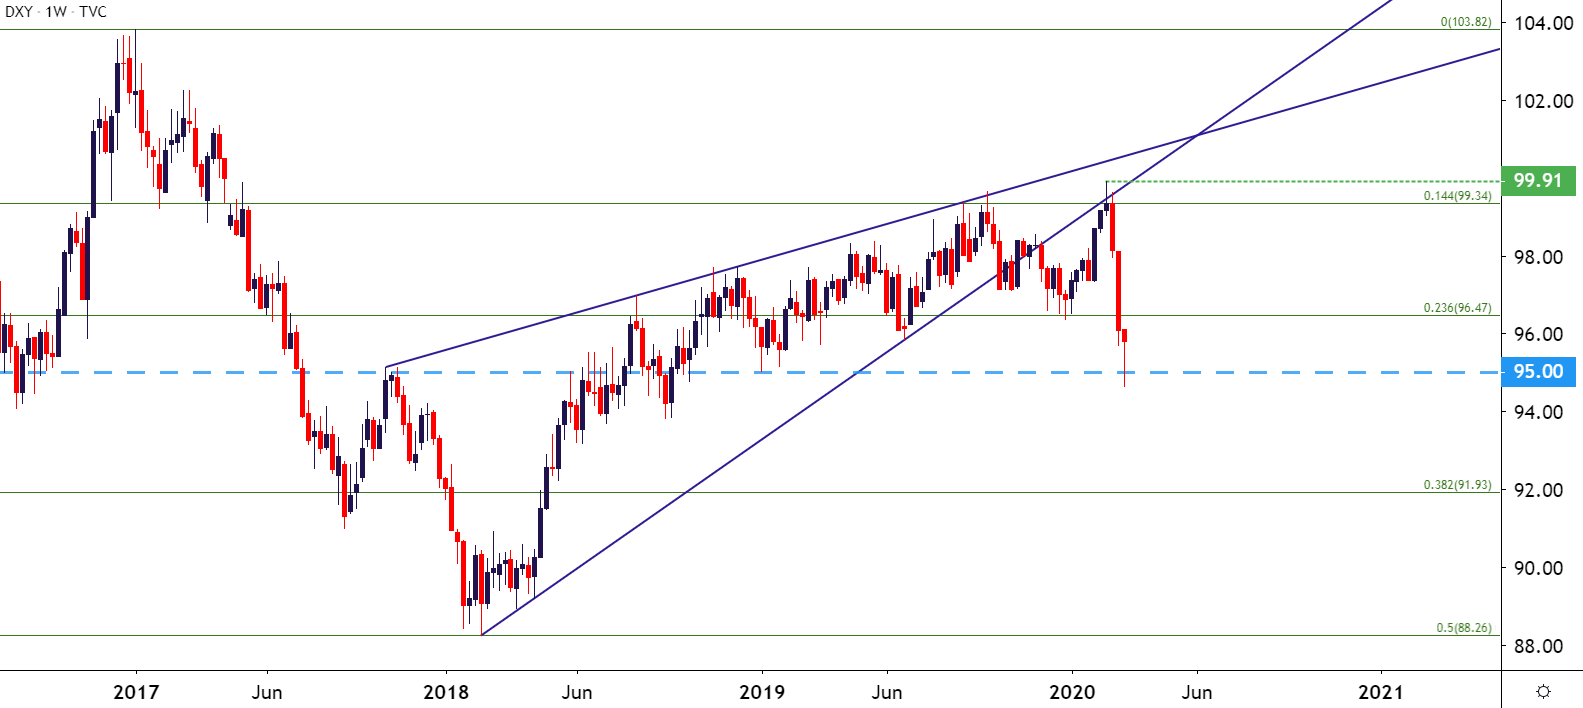
Hardened Bearish Trend Runs into Support
The US Dollar gapped-lower to begin this week’s trade, and continued to run until that 95.00 level could come into play. Since then, however, price action has bounced and filled most of the gap from this week’s open. The top-end of that gap may hold as near-term resistance, particularly should bears remain very aggressive; and a bit higher is another area of potential resistance around the 96.47 Fibonacci level, which had previously helped to hold support at the finish of 2019 trade and through the 2020 open.
US Dollar Four-Hour Price Chart
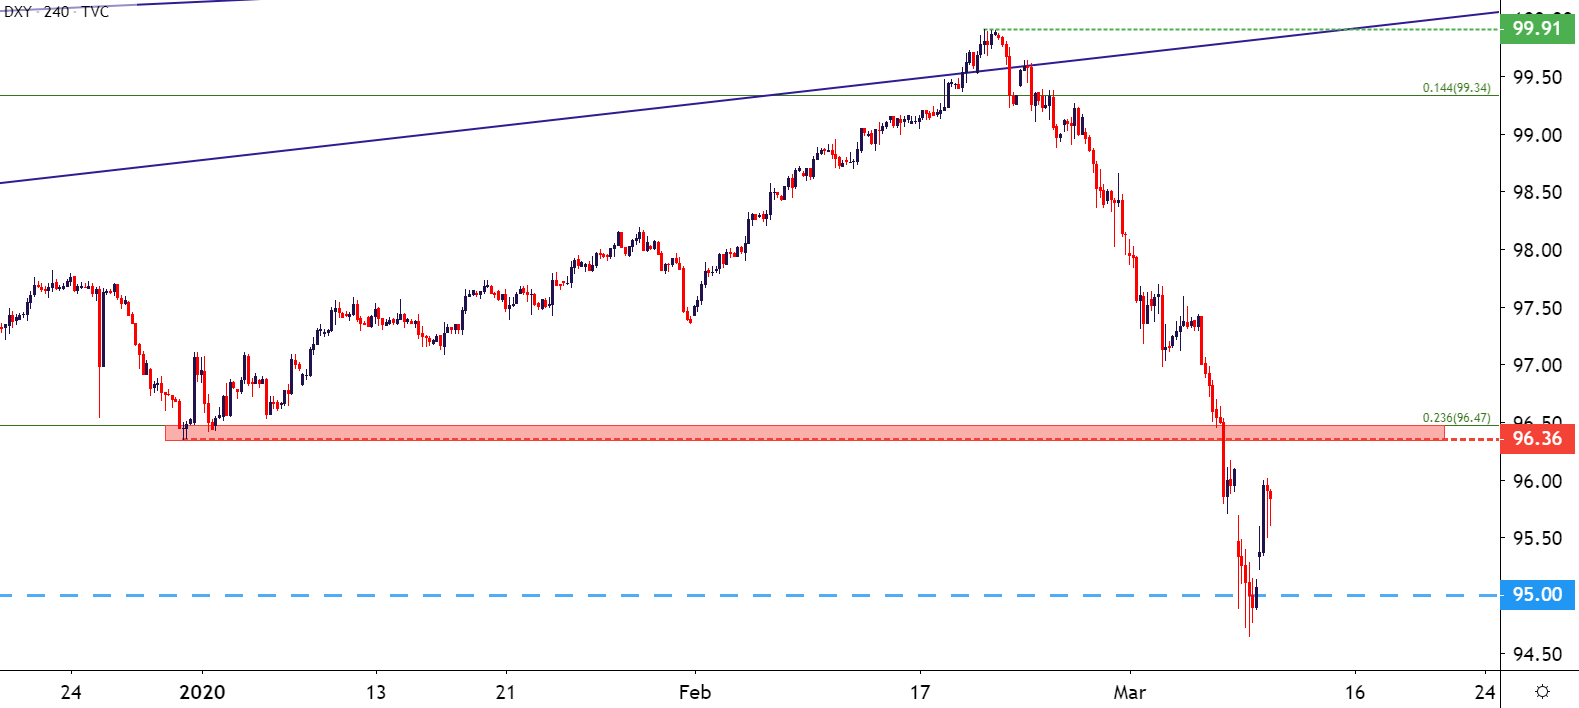
USD on Tradingview
US Dollar: The Context
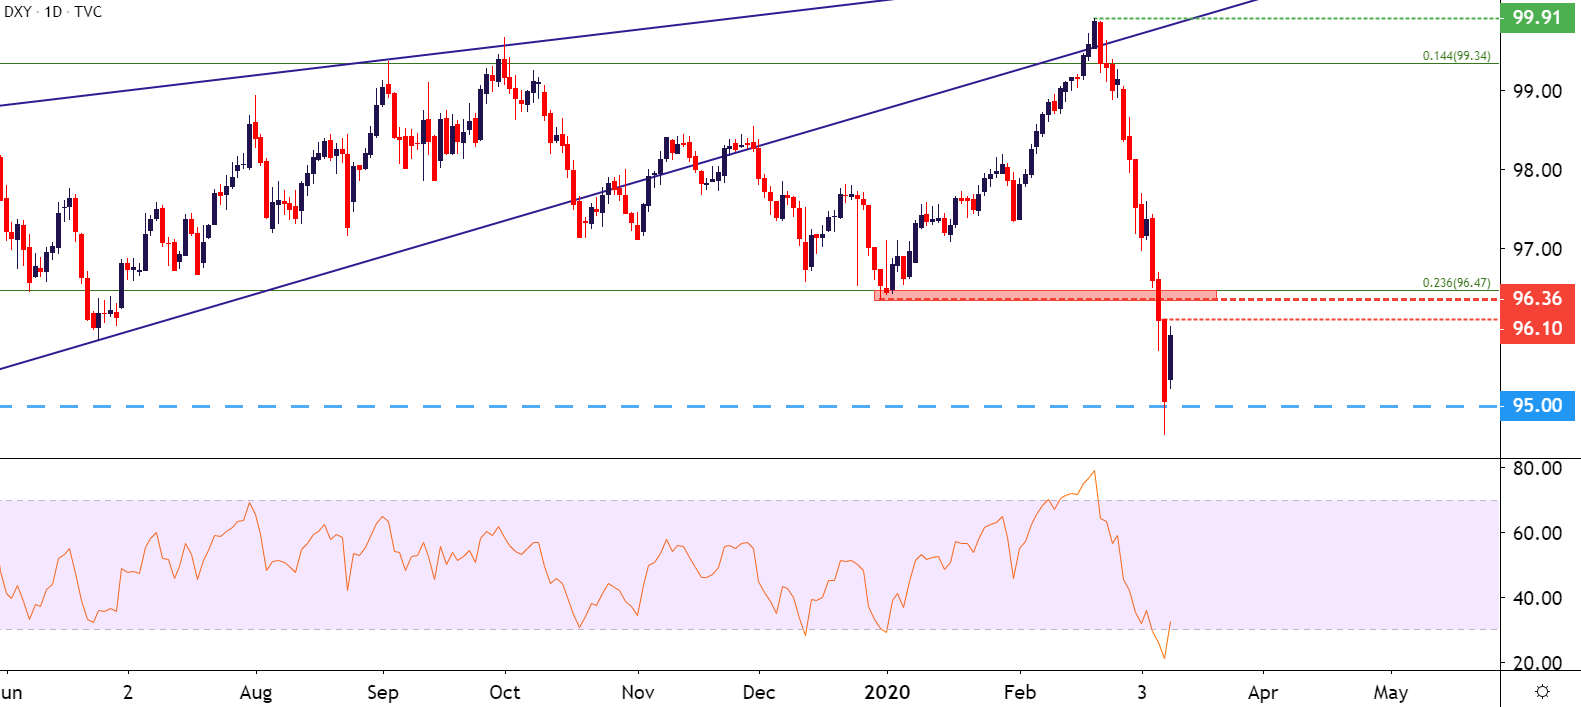
It was just a few weeks ago in these pieces that I had remarked that the US Dollar was at its most overbought since 2018. Now, just a few weeks later, the opposite statement could be made but with a longer-term scope as the US Dollar is now at its most oversold, from the daily chart, since 2012. RSI has just made a push out of oversold territory on the basis of this morning’s rally and this highlights just how incredibly forceful the move has been.

But – if this is carry unwind, which it legitimately could be as markets brace for much lower rates out of the Fed and abandon carry trades in setups like short EUR/USD or short GBP/USD, then there could be more room to fall as rate expectations get further priced-in.
US Dollar Daily Price Chart with RSI Applied
USD on Tradingview
--- Written by James Stanley, Strategist for DailyFX.com
Contact and follow James on Twitter: @JStanleyFX


