


US Dollar, EUR/USD, GBP/USD, USD/JPY Price Analysis
- The US Dollar continues to gain, even with the expectation for the FOMC to soften at some point this year.
- The Fed is expected to cut rates at least one time this year, illustrated by still-falling Treasury rates across the curve.
- The Fed may face a tough ordeal later this year, as economic data currently isn’t all that bad while markets are expecting the FOMC to soften policy.
US Dollar Drives as Fed Backs Deeper into Corner
Economic data in the United States hasn’t been all that bad of recent, evidenced by last week’s CPI data for the month of January. US inflation came in at an annualized 2.5%, much higher than last year’s low read in the indicator at 1.5% and clearly showing some element of response to the bank’s three rate cuts last year.
But – rates markets are still very much expecting some future softening out of the Fed. There’s but a 14% probability (as of this writing) that the Fed doesn’t cut rates by the end of the year. US Treasuries continue to gain ground as yields drive-lower, with the 10-year nearing the vaulted 1.5% marker as the 30-year flirts with sub-3%.
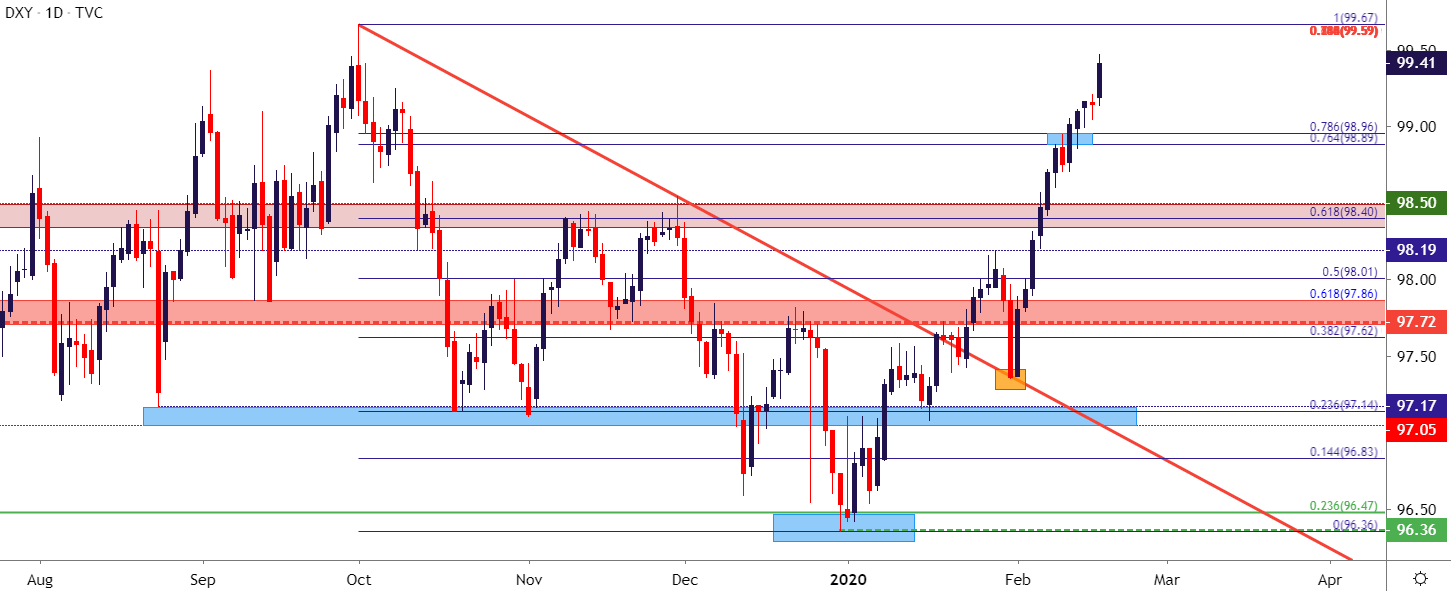
So – why is the US Dollar so incredibly strong? It would appear that risk aversion continues to play a role here as the USD has continued to climb even though the Fed is expected to cut without the same drive of data dependency that’s supported prior moves of softening. The Greenback is now trading at fresh four-month-highs, driving above the zone of resistance that put in a pause last week. Sitting ahead – the 99.67 level currently marks the two-year-high in the USD; and beyond that the 100.00 psychological level on DXY may provide some element of resistance, as well.

US Dollar Daily Price Chart
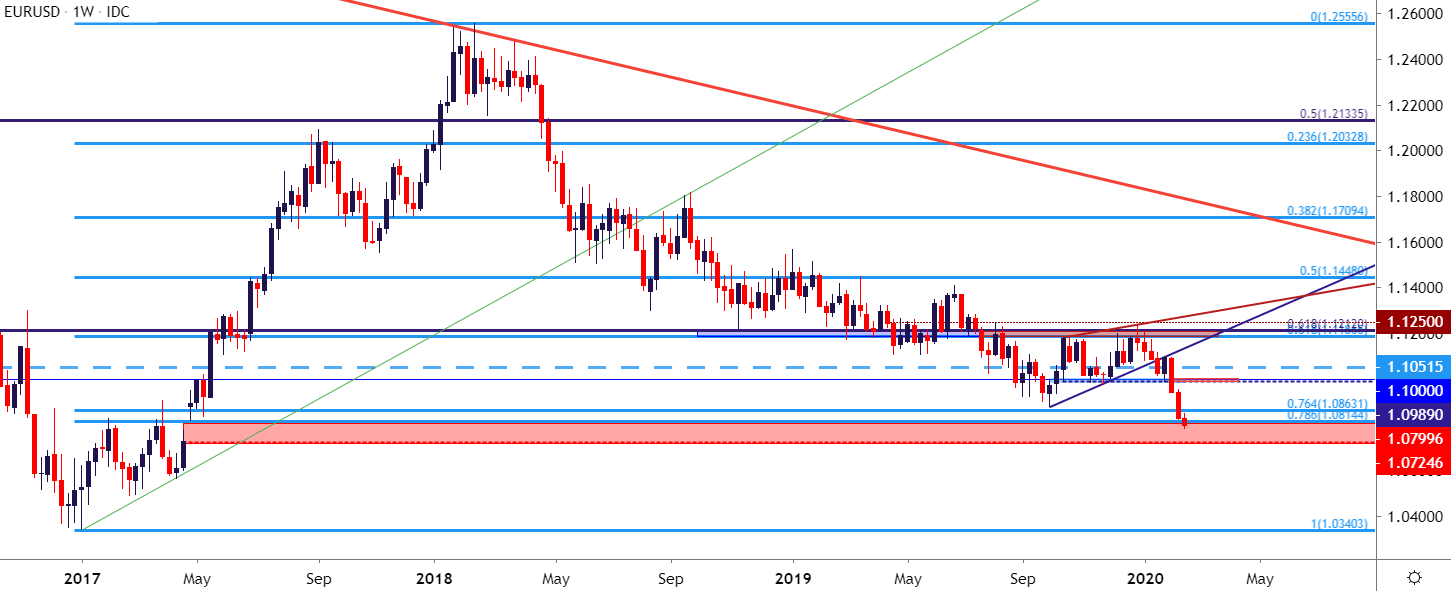
EUR/USD Begins to Fill the Gap
For the past few years, a bit of gap has remained on the EUR/USD chart from the first round of French elections in April of 2017. That gap has now started to fill as sellers have pushed the pair down to a fresh two-year-low.
| Change in | Longs | Shorts | OI |
| Daily | -5% | 14% | 3% |
| Weekly | -19% | 27% | -3% |
EUR/USD Weekly Price Chart
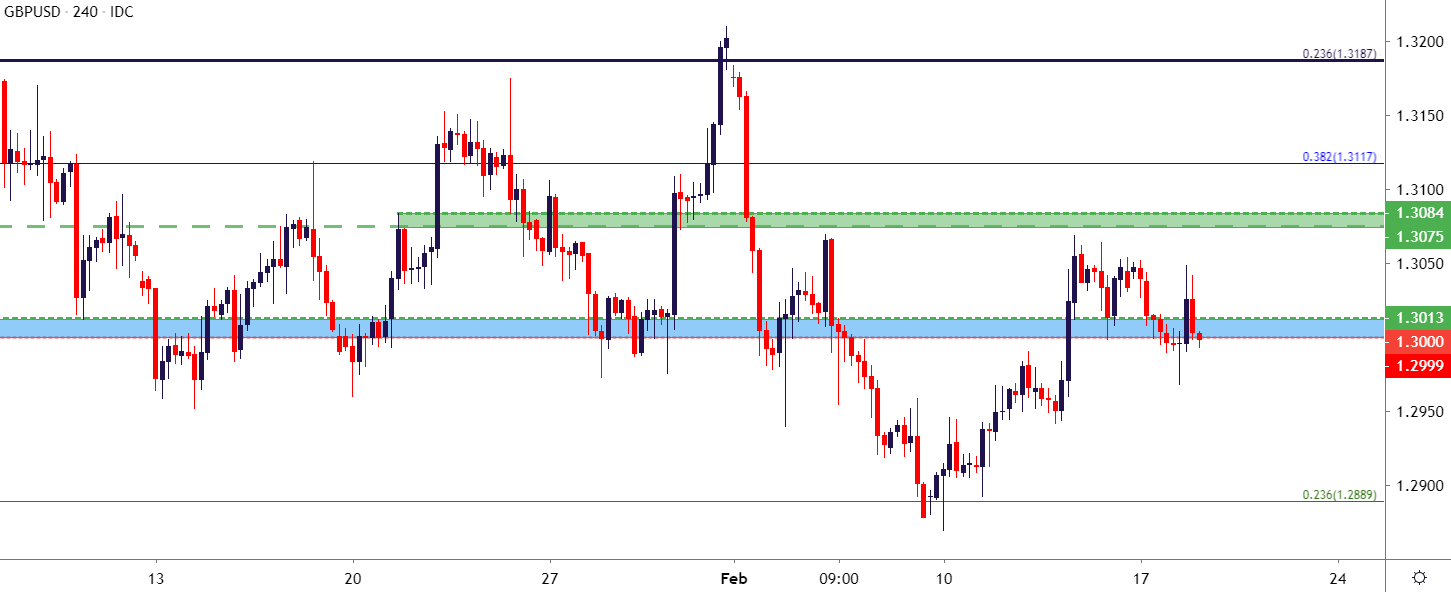
GBP/USD: Messy, but Swing Potential Remains
GBP/USD is lacking for near-term trends but, given the sharp nature of the moves that have developed, the potential can remain for swing strategies off of support and/or resistance. Currently, prices appear to be trying to re-claim support around the 1.3000 spot.
| Change in | Longs | Shorts | OI |
| Daily | -4% | 6% | 0% |
| Weekly | -32% | 41% | -11% |
GBP/USD Four-Hour Price Chart
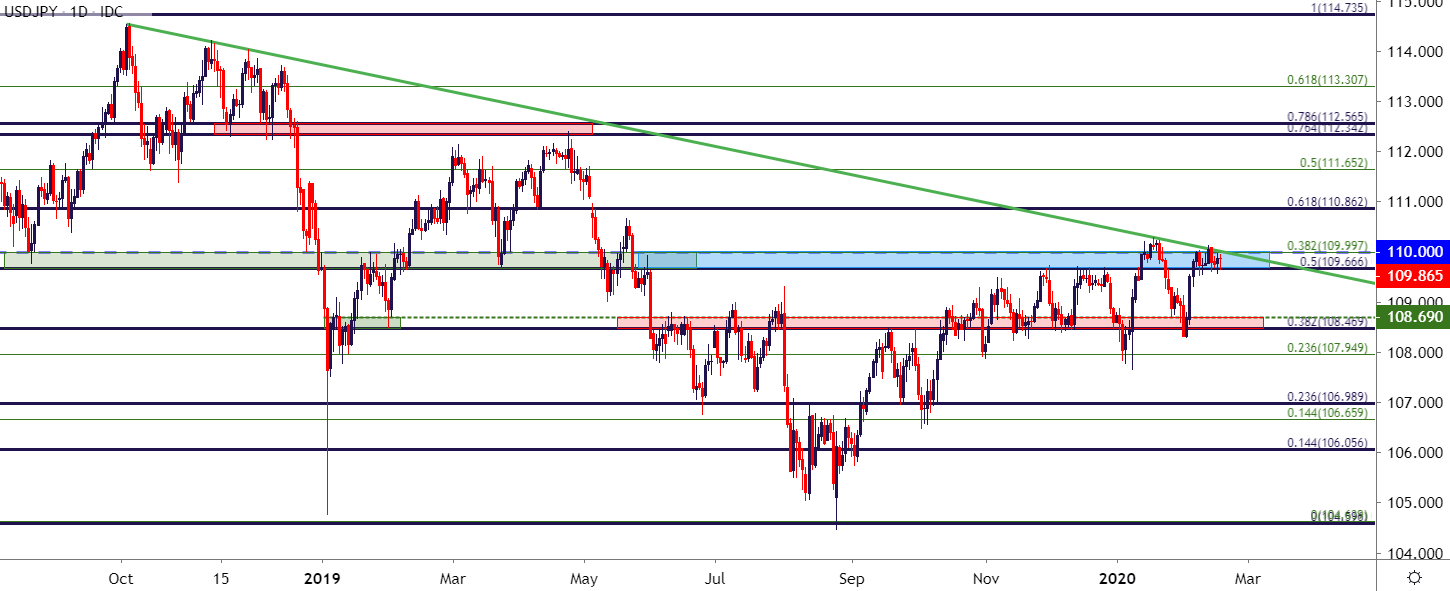
USD/JPY Holds at Key Resistance Zone
While the Dollar is tearing away with strength elsewhere, USD/JPY remains at a key area of chart resistance. As shown during the webinar, a short-term range has developed between Fibonacci levels at 109.67-110.00, with a few different longer-term resistance items coming into play.
| Change in | Longs | Shorts | OI |
| Daily | 29% | -15% | -8% |
| Weekly | 20% | -14% | -9% |
USD/JPY Daily Price Chart
--- Written by James Stanley, Strategist for DailyFX.com
Contact and follow James on Twitter: @JStanleyFX


