


The US Dollar Index (DXY) is teetering on support, and appears headed for a breakdown soon below trend support. With that, the Euro is trying to break its pattern of failed rallies at resistance, but can it? Cable is getting a monster lift on Brexit, beginning to test some important resistance levels; watch how price action plays out at these levels.
Technical Highlights:
- US Dollar Index (DXY) on the verge of a breakdown
- EURUSD trying to break out of the same old pattern
- GBPUSD rally has price pressing on big resistance
See where our team of analysts see your favorite markets and currencies headed in the in the DailyFX Trading Forecasts.
US Dollar Index (DXY) on the verge of a breakdown
The US Dollar Index (DXY) is under pressure again today with the Euro and Sterling rallying. This has trend support from June in focus, and if momentum at this time is any indication support may not hold. A breakdown is seen as leading a larger decline to the September low at 9786, followed by the trend-line rising up off the February 2018 low and 200-day MA (both in near confluence).
US Dollar Index (DXY) Daily Chart (larger decline may be in works)
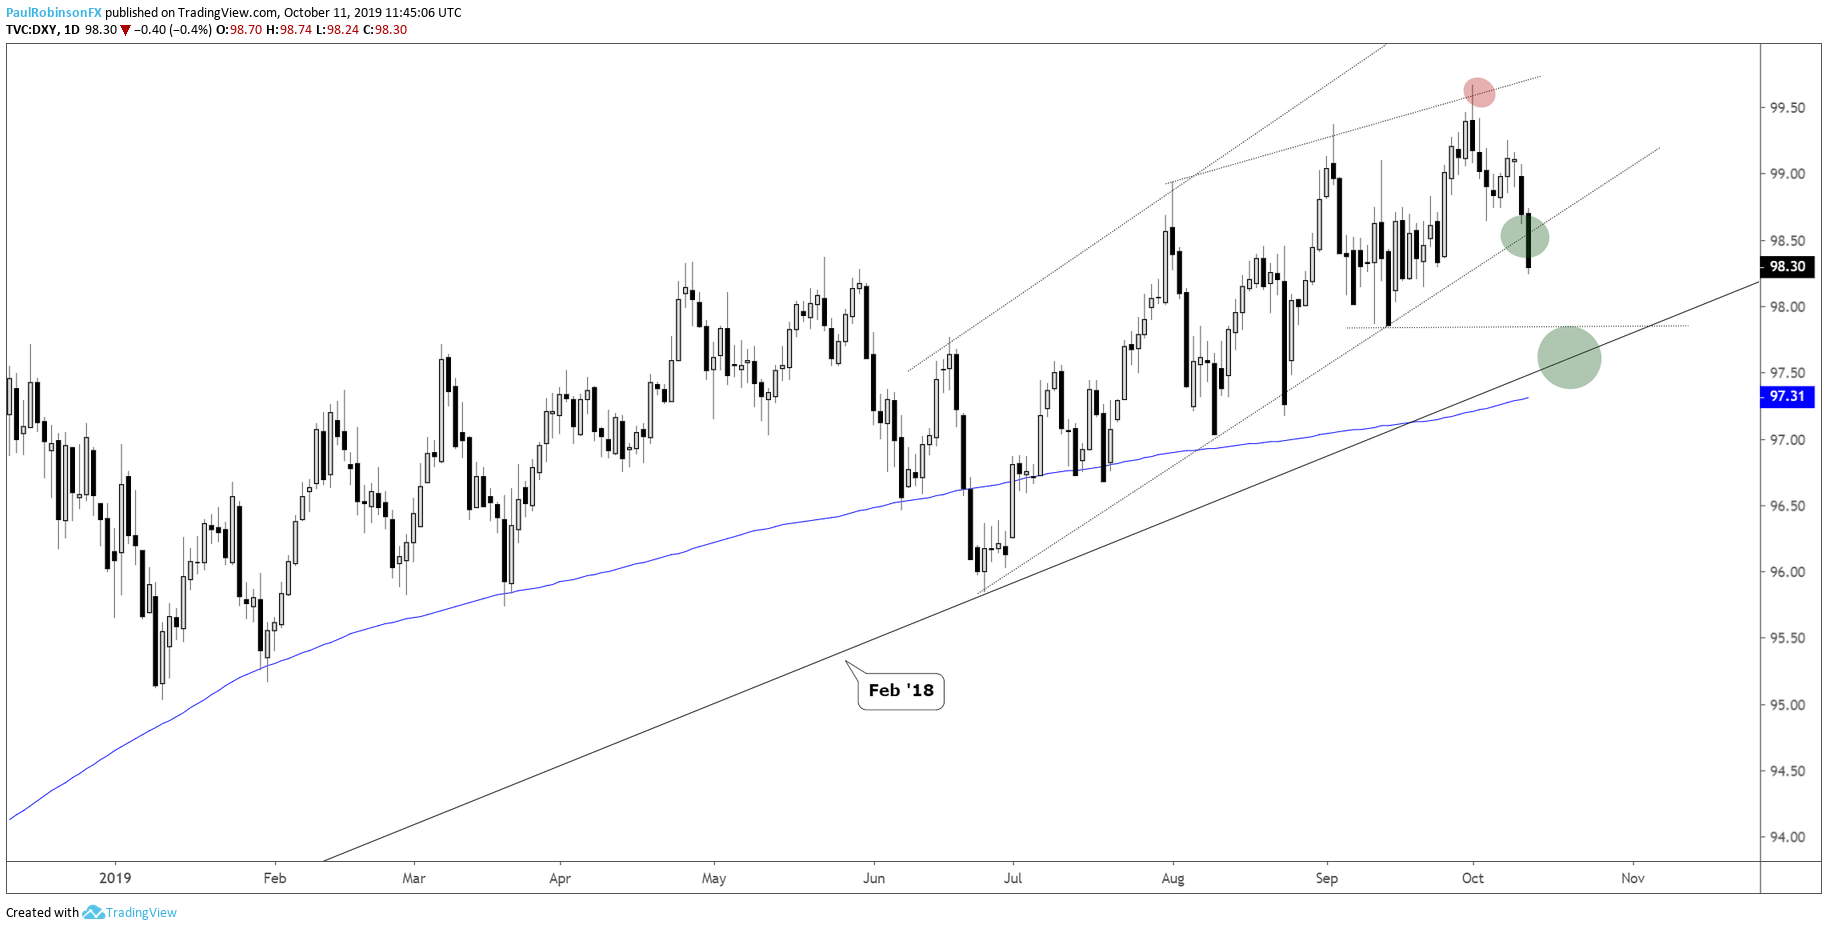
U.S. Dollar Currency Index (DXY) Chart by TradingView
EURUSD trying to break out of the same old pattern
The Euro is helping push the DXY over the edge, and is currently on the verge of breaking its sequence of stalling at trend resistance. The trend-line from late June held price in check yesterday, but as of now that is in the rear-view mirror. The area around 11085 is resistance, then beyond there the February 2018 trend-line.
EURUSD Daily Chart (working towards breaking resistance)

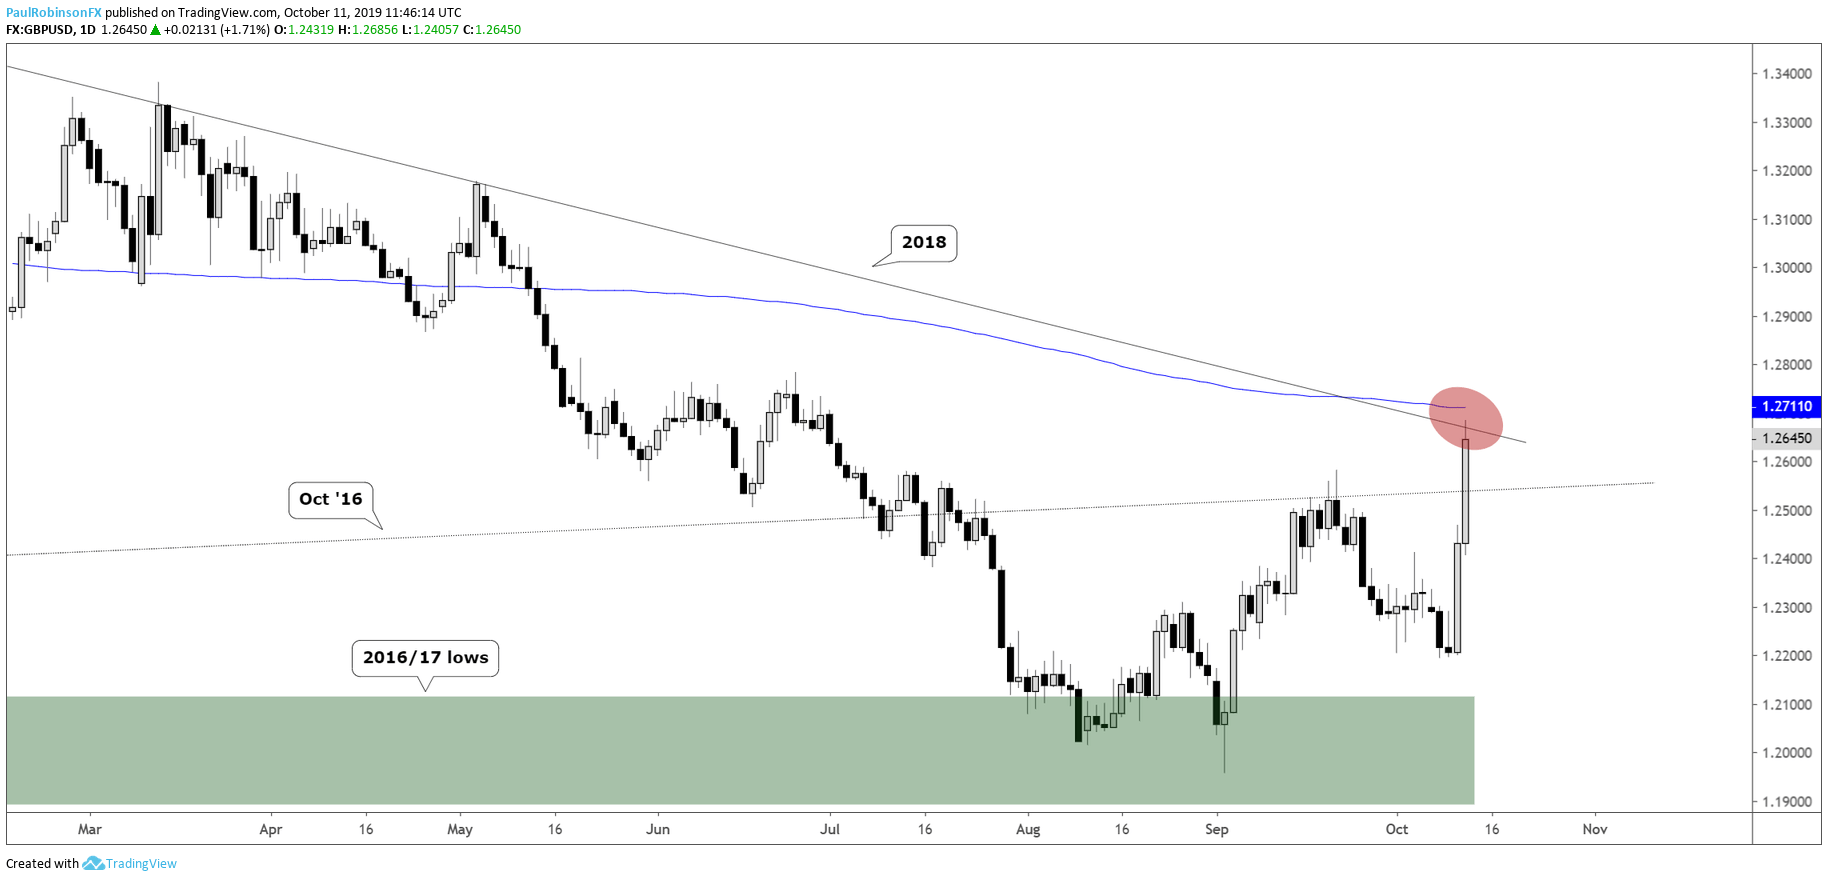
GBPUSD rally has price pressing on big resistance
GBPUSD is putting in a monster day-and-a-half so far, with it now testing the trend-line from April 2018 and very nearly the 200-day MA. This could make for an interesting spot as confluent trend resistance comes into play. It’s a spot to look for Cable to stall, but that doesn’t, with headline risk and momentum in play, necessarily make it a great spot to be short.
GBPUSD Daily Chart (big momentum into confluent resistance)
Resources for Forex & CFD Traders
Whether you are a new or an experienced trader, DailyFX has several resources available to help you; indicator for tracking trader sentiment, quarterly trading forecasts, analytical and educational webinars held daily, trading guides to help you improve trading performance, and one specifically for those who are new to forex.
---Written by Paul Robinson, Market Analyst
You can follow Paul on Twitter at @PaulRobinsonFX


