


The Dollar picture has continued to be a sore spot for traders as directional bets are easy to fail, quick to reverse. USDCAD is showing lots of weakness and approaching an important long-term form of support. GBPUSD is also at a big long-term trend-line, which makes how it reacts here a key development to watch. EURJPY, like the USD pairs we are looking at today, is trading around an important area of support.
Technical Highlights:
- USDCAD weak, about to test trend-line from 2012
- GBPUSD hovering around October 2016 trend-line
- EURJPY testing the 2012 trend-line for a 3rd time in 6 weeks
See where our team of analysts see your favorite markets and currencies headed in the in the DailyFX Trading Forecasts.
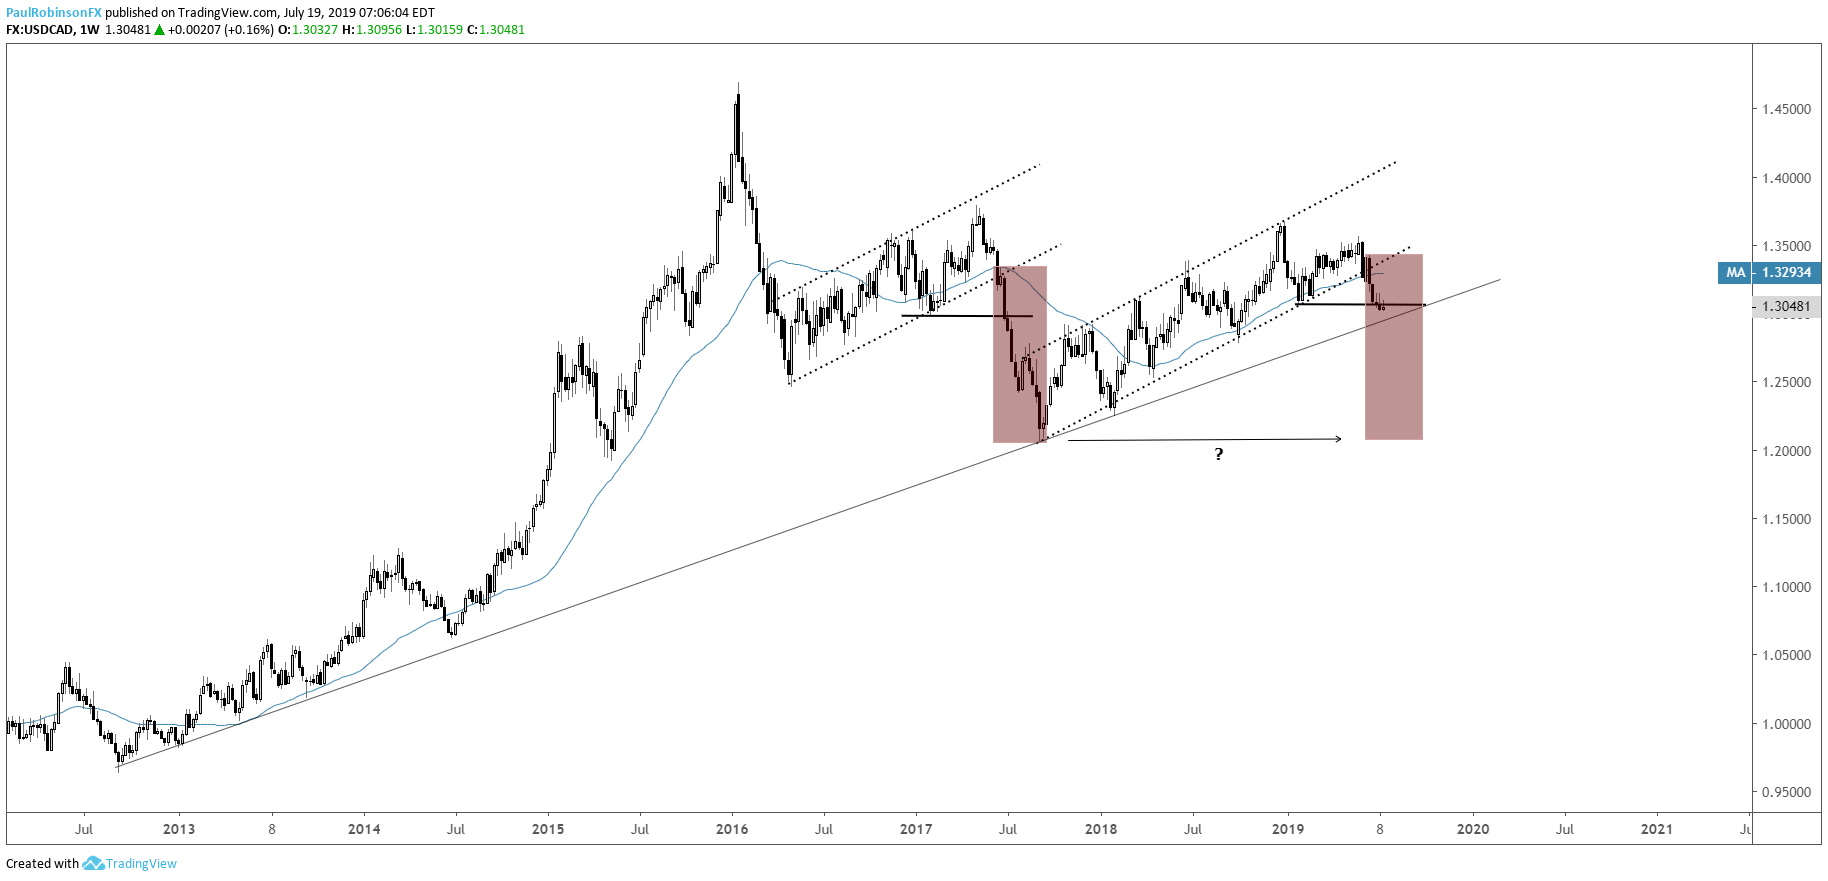
USDCAD weak, about to test trend-line from 2012
USDCAD is currently displaying weak price action as it approaches the 2012 trend-line. It will be an important test, as the current decline on the weekly looks similar to the one that unfolded during 2017. Watch how price action plays out at the trend-line, a hold will keep it afloat while a drop below the long-term threshold will further the notion that we are seeing a redux of the 2017 breakdown from a grinding upward, corrective channel.
USDCAD Weekly Chart (2017? | 2012 t-line)
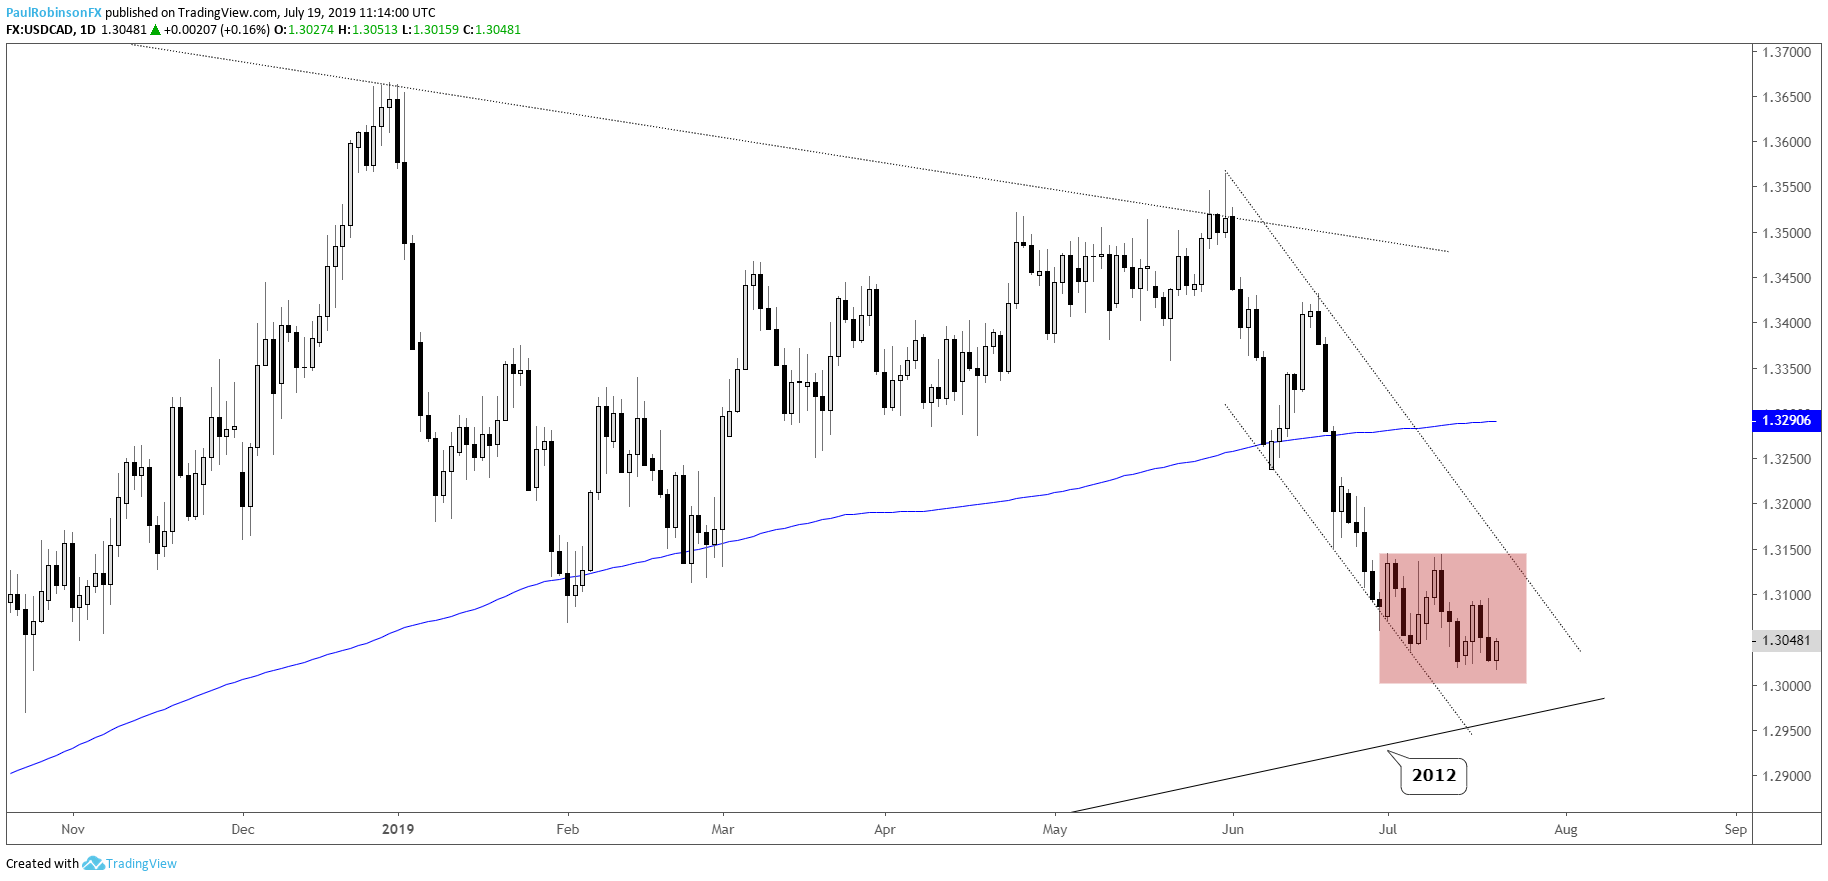
USDCAD Daily Chart (weak price action)
GBPUSD hovering around October 2016 trend-line
Cable is trading around the trend-line rising up from the October 2016 flash-crash low. It breached it on a daily basis, but given the long-term nature of it we need to give it a little room. The trading bias isn’t very strong, but for those trading it from either side it is a big line-in-the-sand to be mindful of. I also discussed a few of the other GBP-pairs at major cross-roads (see video).
GBPUSD Weekly Chart (hanging onto Oct ’16 t-line by a thread)

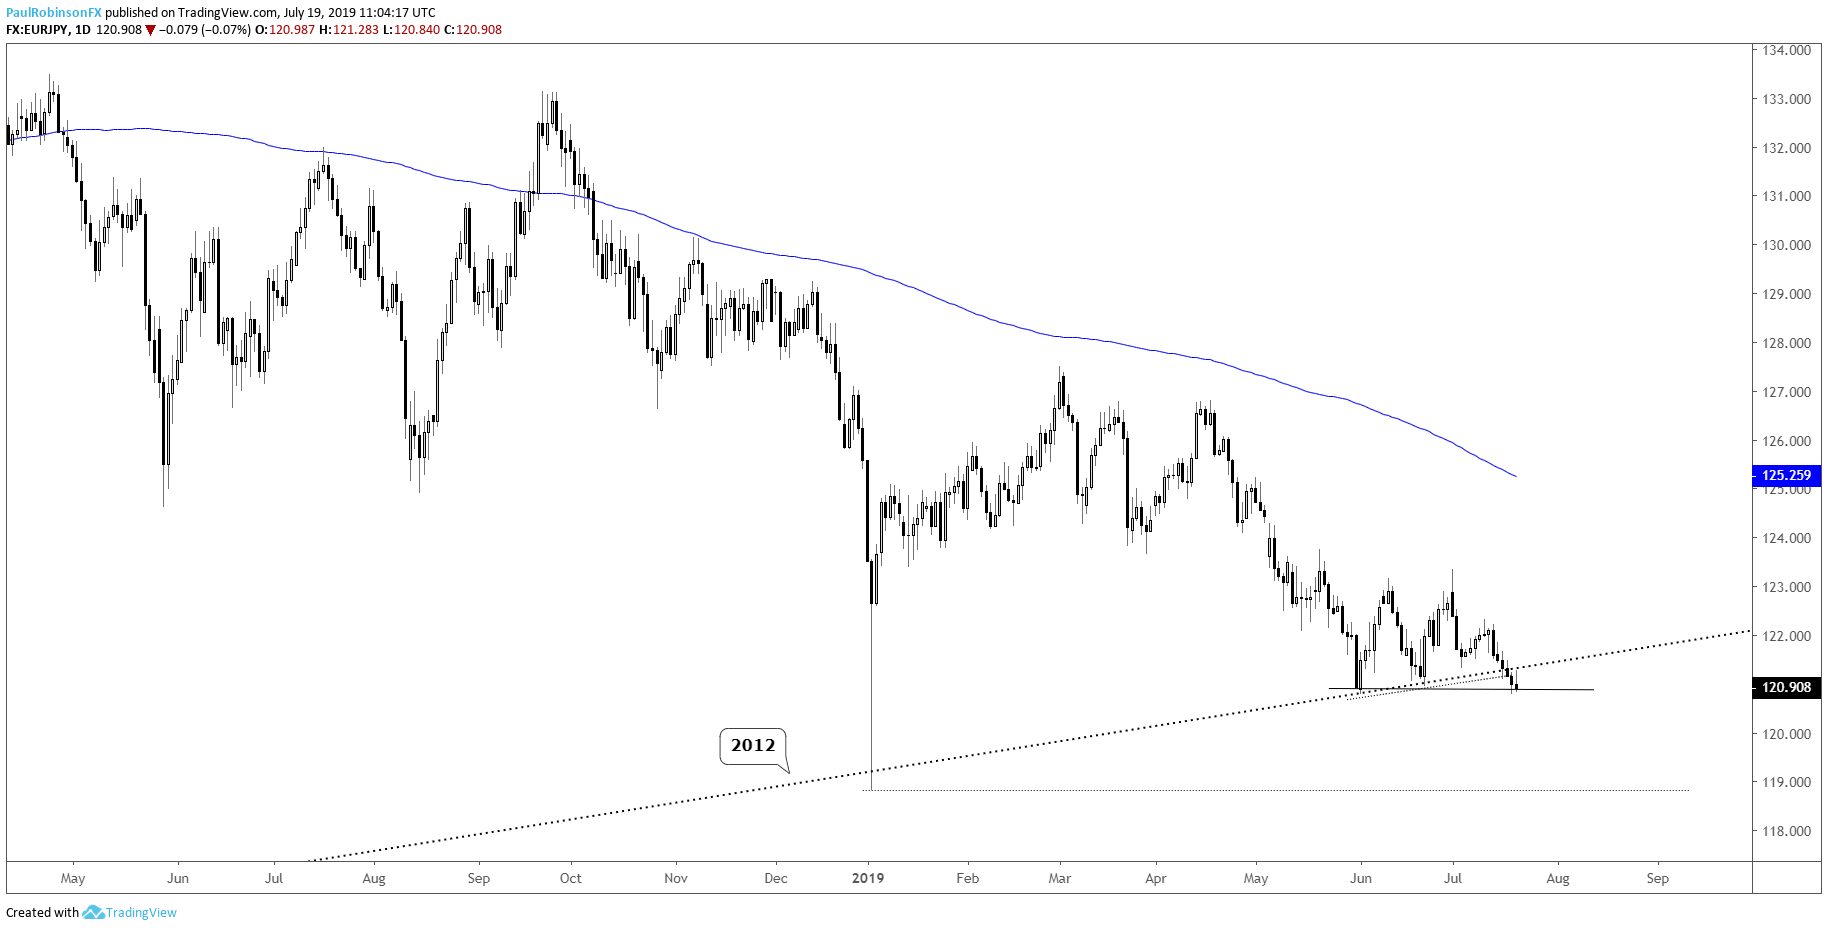
EURJPY testing the 2012 trend-line for a 3rd time in 6 weeks
EURJPY is firmly testing the trend-line rising up since 2012. Multiple tests are taking shape and so far, it is holding, but not with a whole lot of conviction. A breakdown could have the January flash-crash low just 119 in play, while a hold keeps EURJPY moving sideways for now.
EURJPY Daily Chart (2012 t-line under siege)
Resources for Forex & CFD Traders
Whether you are a new or an experienced trader, DailyFX has several resources available to help you; indicator for tracking trader sentiment, quarterly trading forecasts, analytical and educational webinars held daily, trading guides to help you improve trading performance, and one specifically for those who are new to forex.
---Written by Paul Robinson, Market Analyst
You can follow Paul on Twitter at @PaulRobinsonFX


