


Gold price is trying to hang onto trend-line support from August, but if it soon fails it might mean a meaningful decline unfolds next week. The Dollar looks set to trade to new levels not seen in a couple of years; Euro, Aussie, and Kiwi look especially vulnerable. Plus, we going to look at a bonus chart that could soon come into play…
Technical Highlights:
- Gold price flirting with break of August trend-line
- EURUSD chart points to new swing lows soon
- AUDUSD & NZDUSD charts are especially vulnerable
See where our team of analysts see your favorite markets and currencies headed in the in the DailyFX Trading Forecasts.
Gold price flirting with break of August trend-line
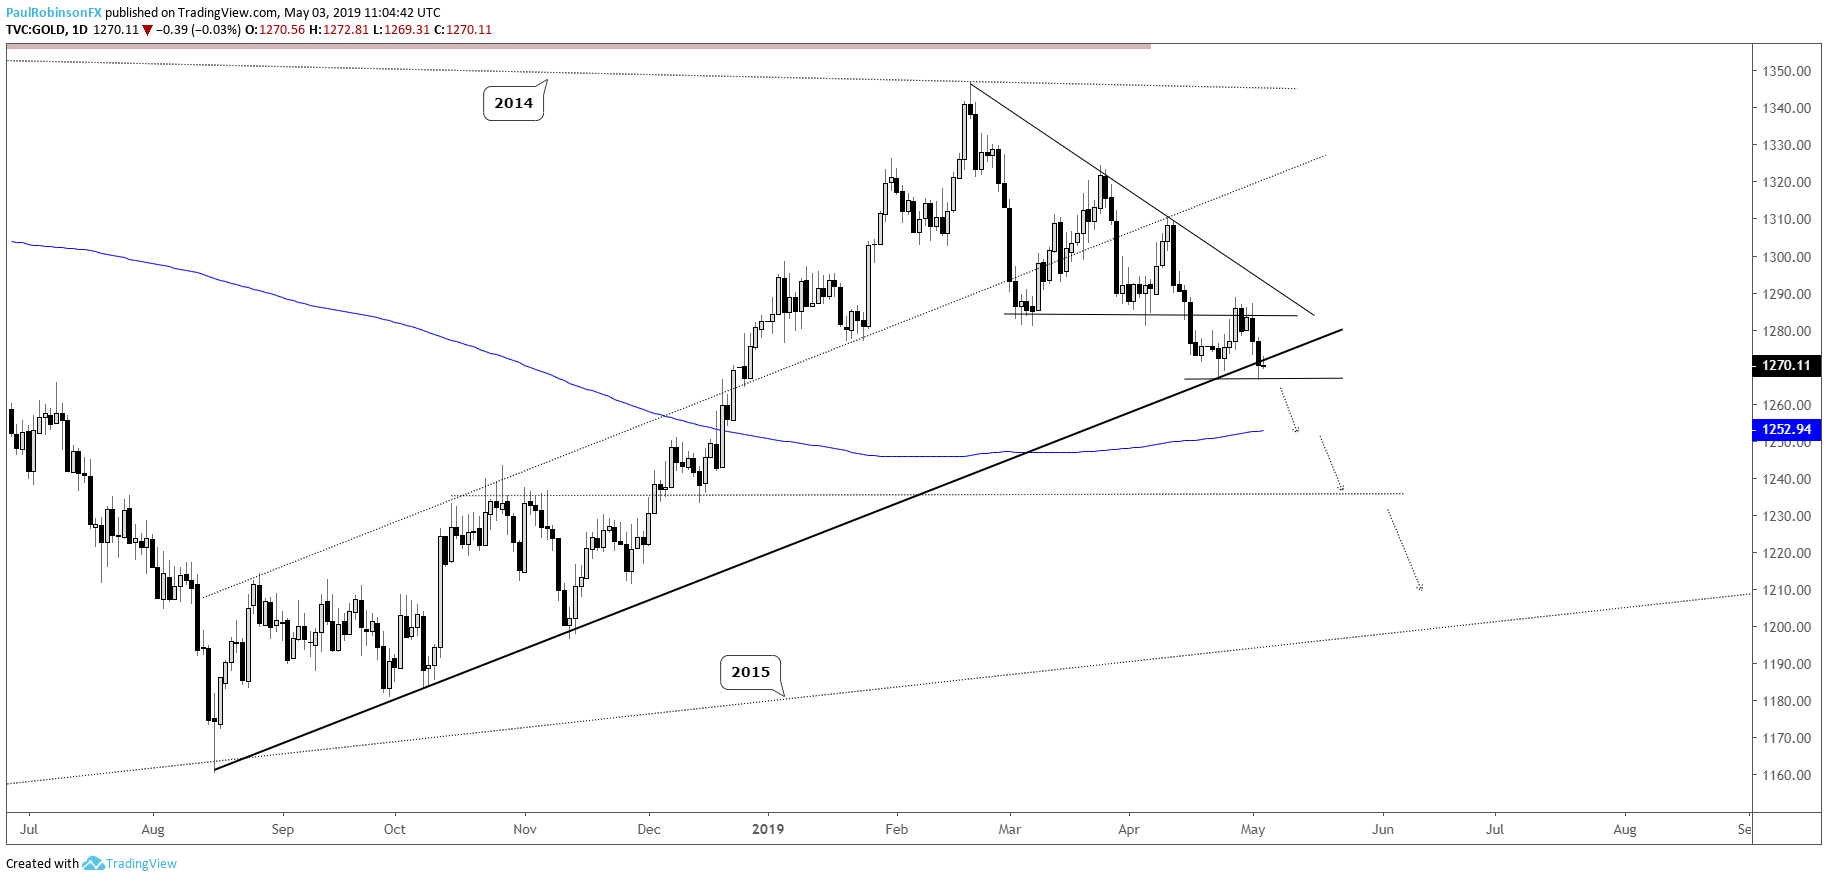
Gold price is sitting on the August trend-line following a retest of the underside of the descending wedge top it had formed for the better part of two months. A decisive break of the trend-line will have the 200-day MA at 1253 in focus, followed by the 1230s.
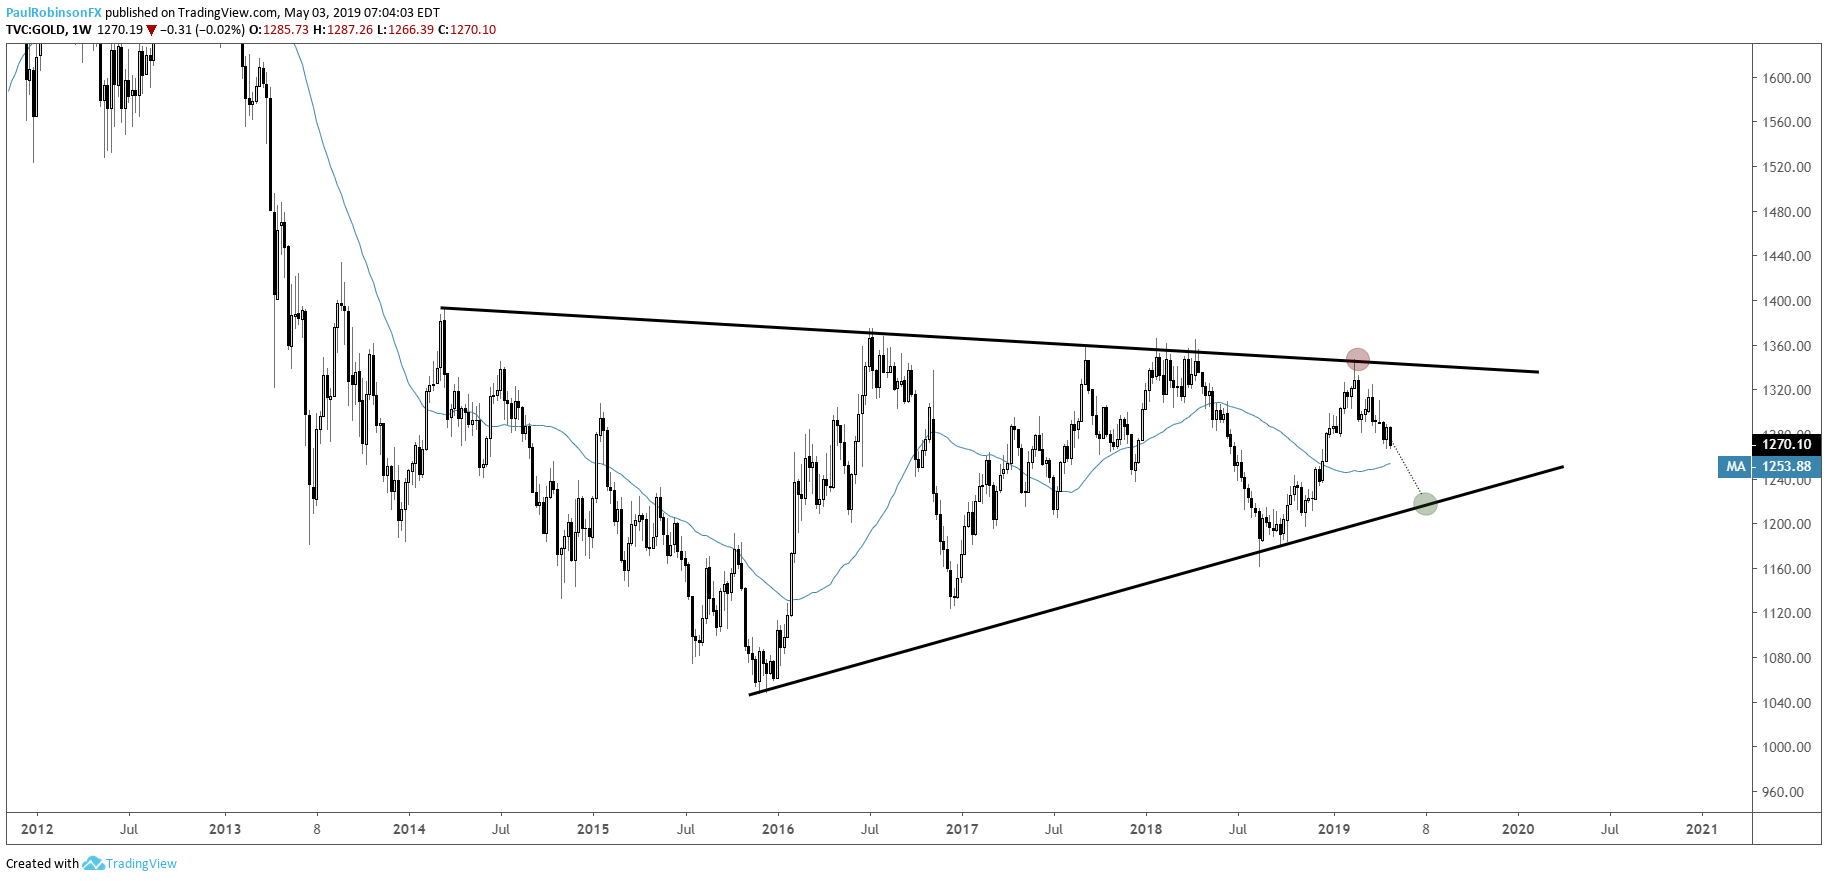
But a larger move is anticipated with there being plenty of room to trade down to the bottom of a long-term wedge, not arriving until the low 1200s. If the trend-line holds the outlook won’t turn bullish but will stave off selling for the moment, but perhaps all it does is turnout to be a congestion pattern which leads to an eventual breakdown. At this time things don't look too good for gold.
Gold Price Daily Chart (August t-line in jeopardy)
Gold Price Weekly Chart (long-term wedge)
Find out where our analysts see Gold heading in the coming weeks based on both fundamental and technical factors – Q2 Gold Forecast
EURUSD chart points to new swing lows soon
The Euro posted a bearish daily reversal candle the other day off the trend-line running lower since the March peak. Price is already halfway back down towards the low from last month at 11110, but if recent history is any guide then we should see a fresh swing-low develop. There are support lines near the 11100-level to keep an eye on. They may put in yet another floor in EURUSD as new lows have not held for long once carved out. A break below 11000 would be reason to look for selling to accelerate, with eyes on the 2017 French election gap at 10724.
Find out where our analysts see the Euro heading in the coming weeks based on both fundamental and technical factors – Q2 Euro Forecast
EURUSD Daily Chart (looking for a new low at the least)

AUDUSD & NZDUSD charts are especially vulnerable
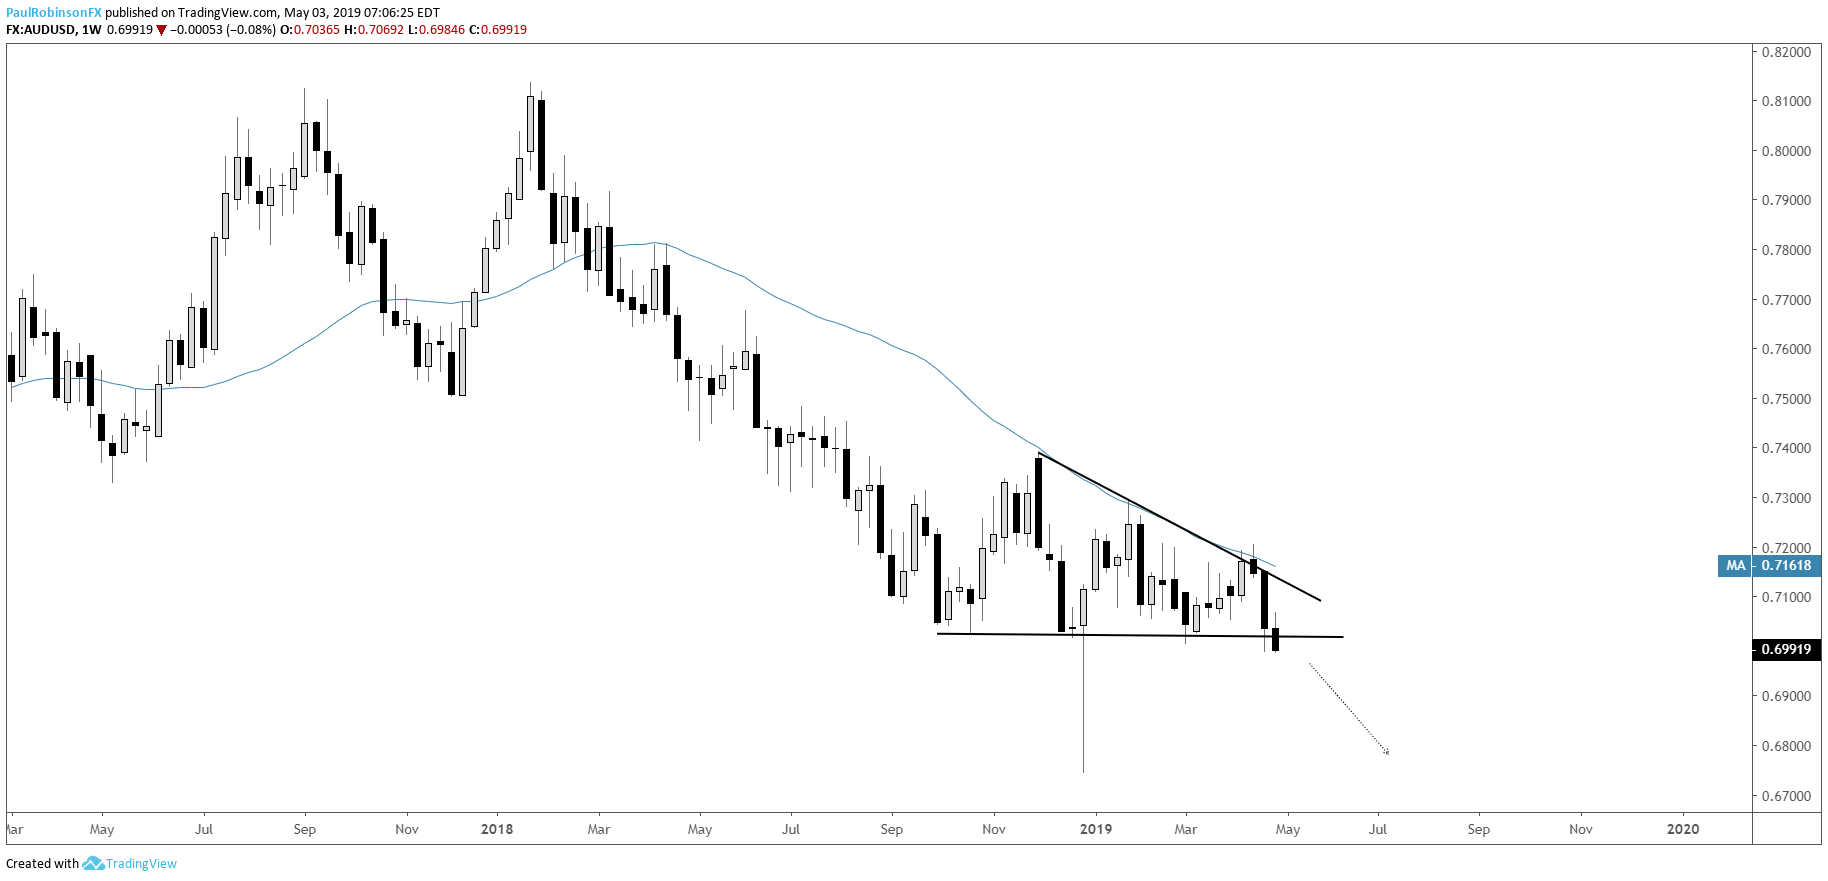
AUDUSD is very close to trading below the important 7000-line in a meaningful way, the bottom of a broad wedge dating back to October. The 3-month range has led to some of the tightest trading conditions in quite a while. This coiled up price action is set to expand into a large swing, with the downside most likely. A weekly close below 7000 will add further conviction to a bearish trading bias. A hold above 7000 keeps the trading bias neutral to maybe even slightly positive as the wedge may want to further fill out before breaking.
AUDUSD Weekly Chart (close below 7000 opens up for more losses)
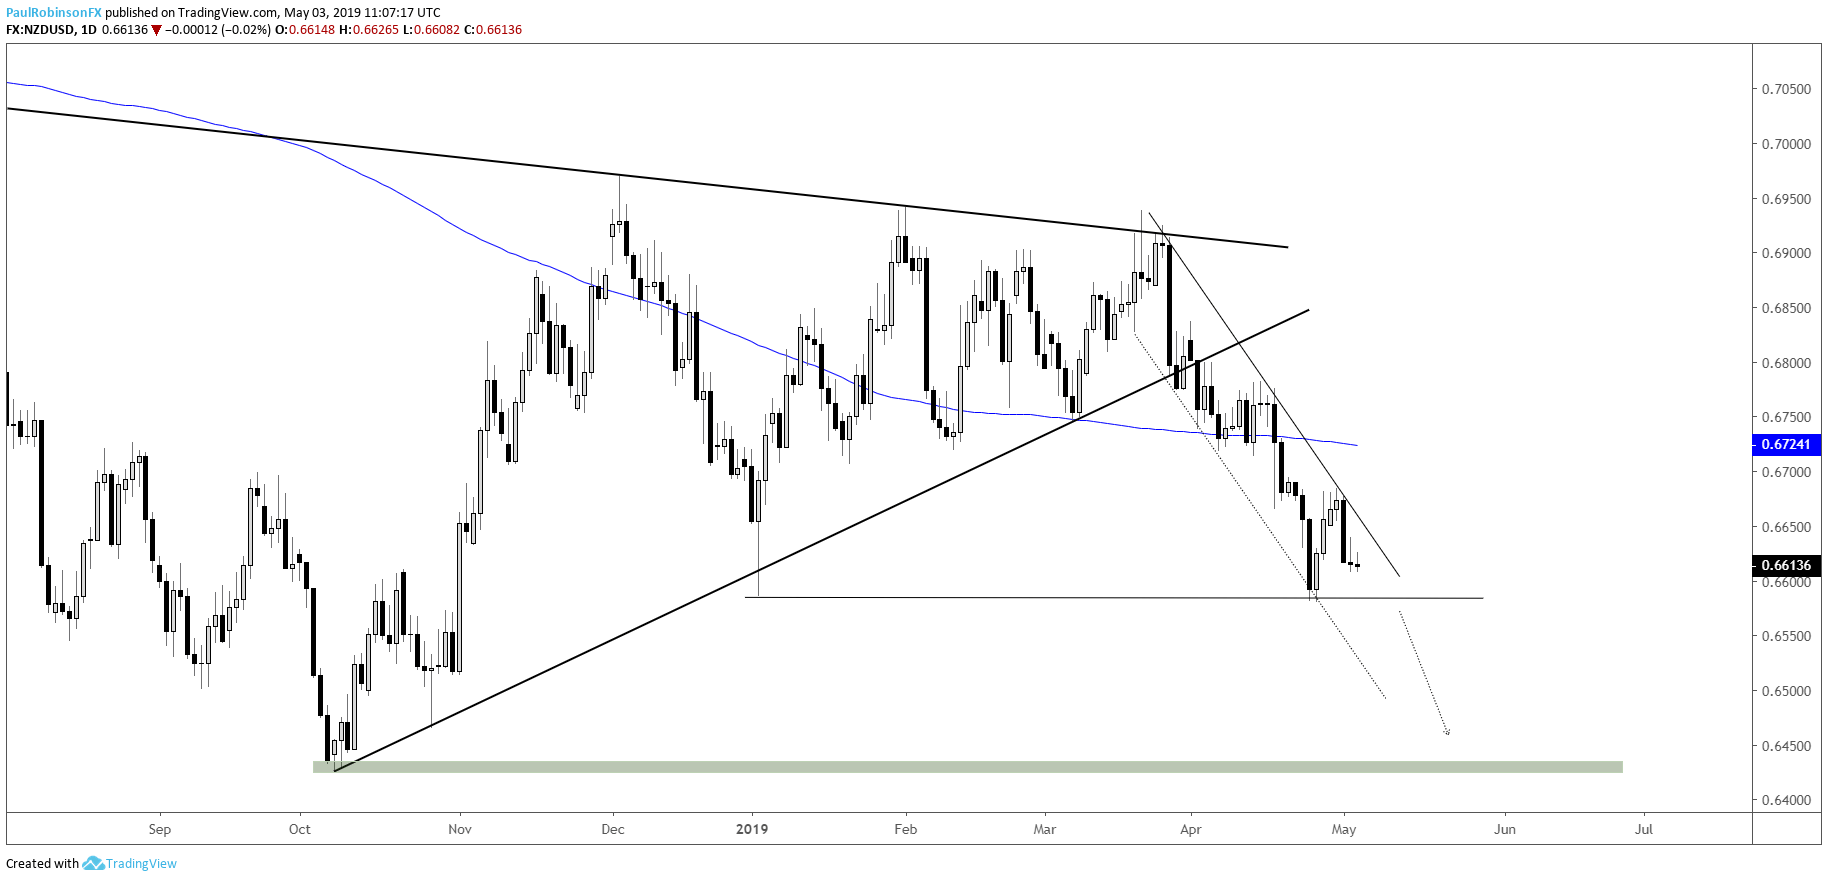
At the beginning of last month Kiwi ended a long stretch of extremely tight trading conditions, and on the breakdown it has formed a solid downtrend. The trend-line off the March high keeps it focused lower at the moment. A break below 65800 should open up a path towards the 64000s where lies a trend-line from 2015 and the lows from last year.
NZDUSD Daily Chart (trading lower in-line w/t-line)
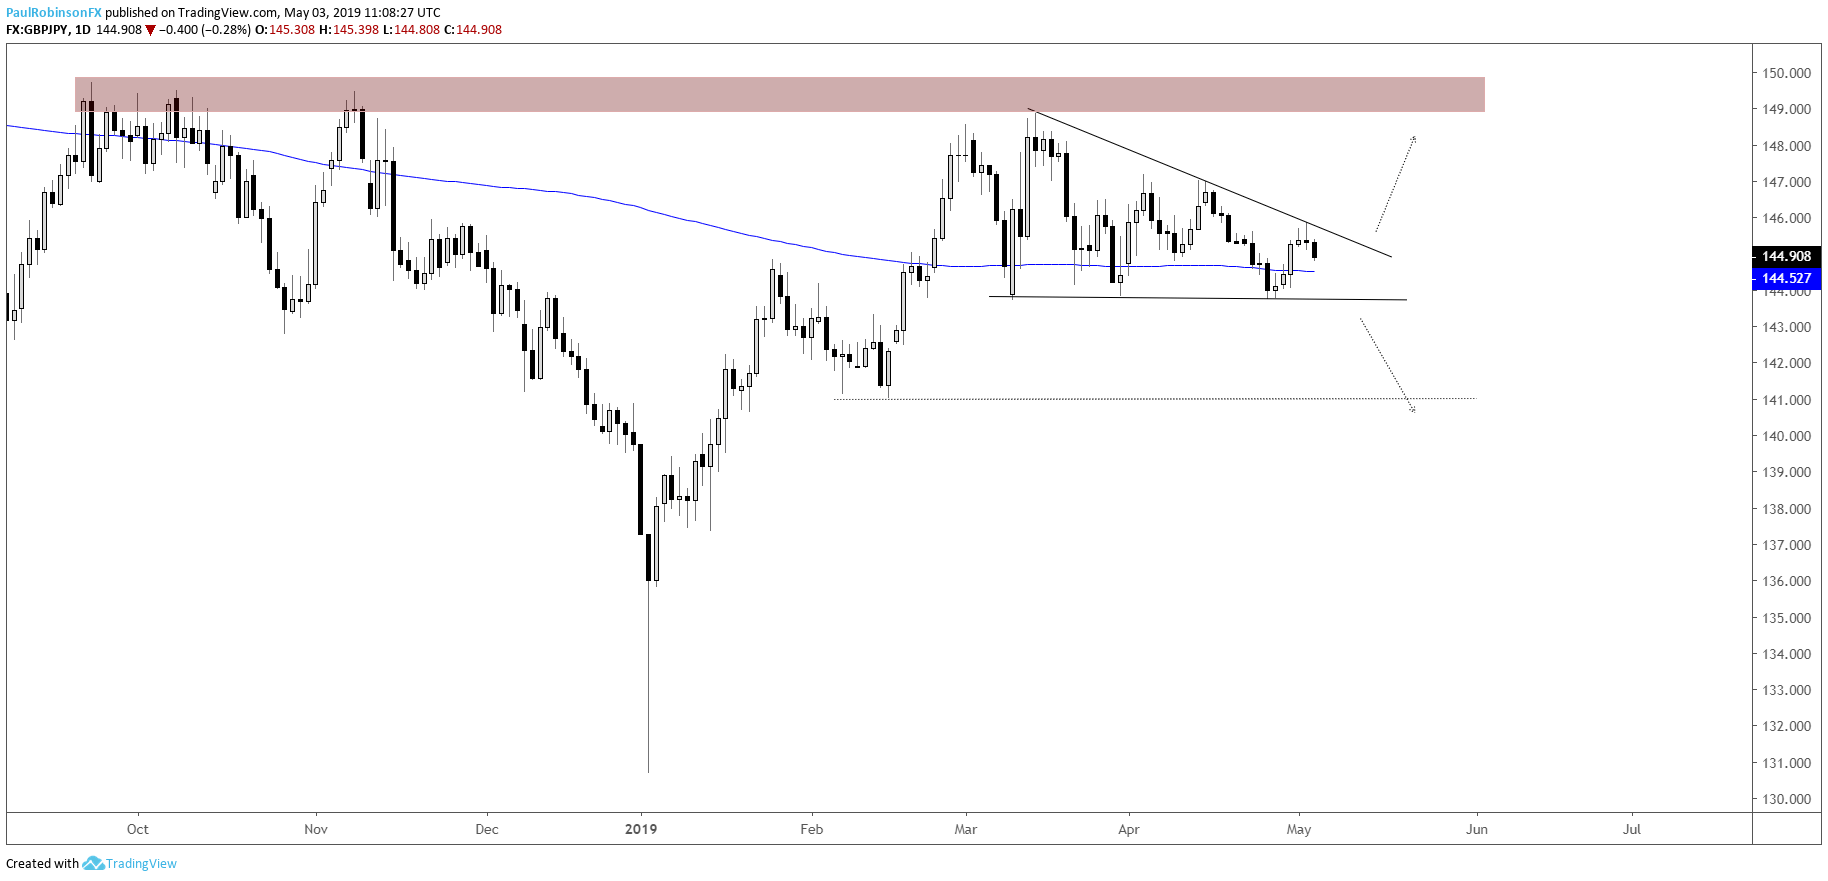
Bonus Chart: GBPJPY Daily Chart (Descending wedge coming together nicely)
Resources for Forex & CFD Traders
Whether you are a new or an experienced trader, DailyFX has several resources available to help you; indicator for tracking trader sentiment, quarterly trading forecasts, analytical and educational webinars held daily, trading guides to help you improve trading performance, and one specifically for those who are new to forex.
---Written by Paul Robinson, Market Analyst
You can follow Paul on Twitter at @PaulRobinsonFX


