


The US Dollar Index (DXY) is poised to continue recent strength but generally trading conditions could continue to tighten before seeing a breakout in volatility. USDCAD exploded off support and is triggering a technical pattern, positioning it to rally further in days/weeks ahead. AUDUSD is very near triggering a technical pattern which should lead to selling, while AUDJPY is nearing its own breakout point. Gold has some support soon, but overall pressure expected to remain.
Technical Highlights:
- US Dollar Index (DXY) poised to continue recent strength
- USDCAD triggering bullish pattern, higher prices to come
- AUDUSD & AUDJPY charts have solid technical patterns
- Gold may post small bounce soon but sellers to remain
See where our team of analysts see your favorite markets and currencies headed in the months ahead on in the Q1 Trading Forecasts.
US Dollar Index (DXY) poised to continue recent strength
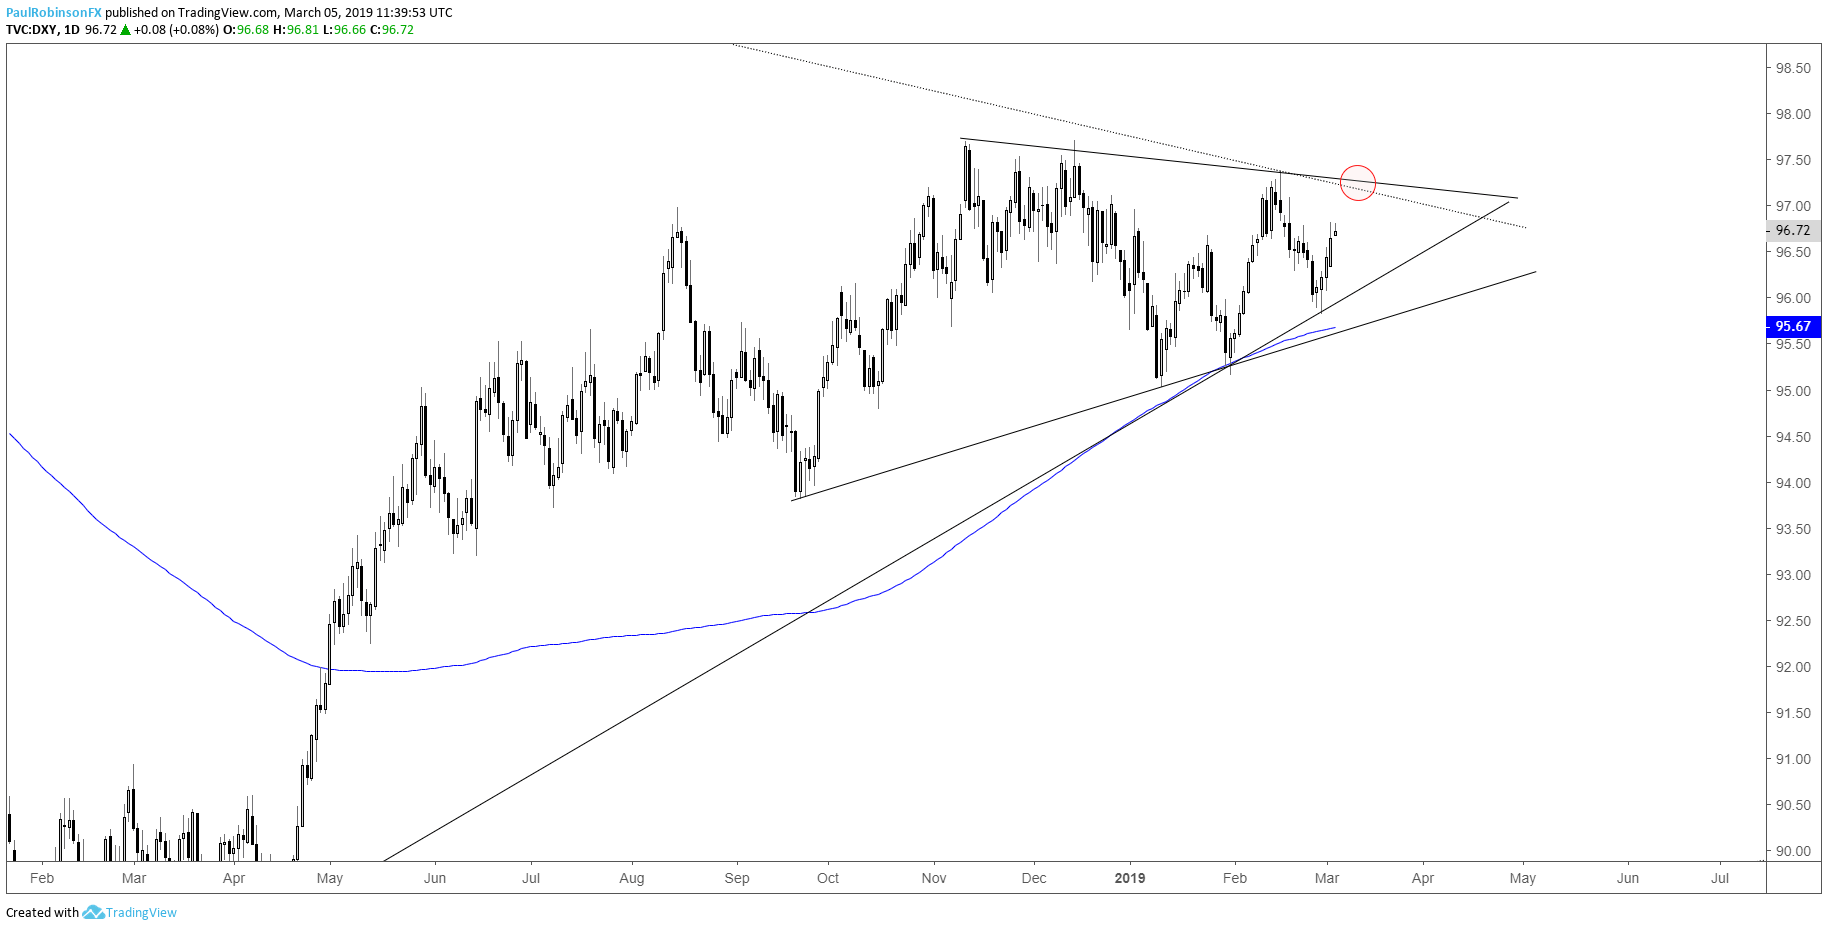
The US Dollar Index (DXY) has room to go before it runs into resistance by way of a trend-line from January 2017, but more importantly the one from November which could make up the top-side of a developing wedge. Volatility hasn’t been trader-friendly, and it may get a little worse before it gets better. This can be seen in the coiling up price action in recent months which may continue out into next month or a little longer. For now, more strength in the short-term is anticipated before another reversal possibly develops near 97.25.
US Dollar Index (DXY) (Room to potential wedge resistance)
Check out the Q1 USD Forecast to see our analysts’ intermediate-term fundamental and technical outlook.
USDCAD triggering bullish pattern, higher prices to come
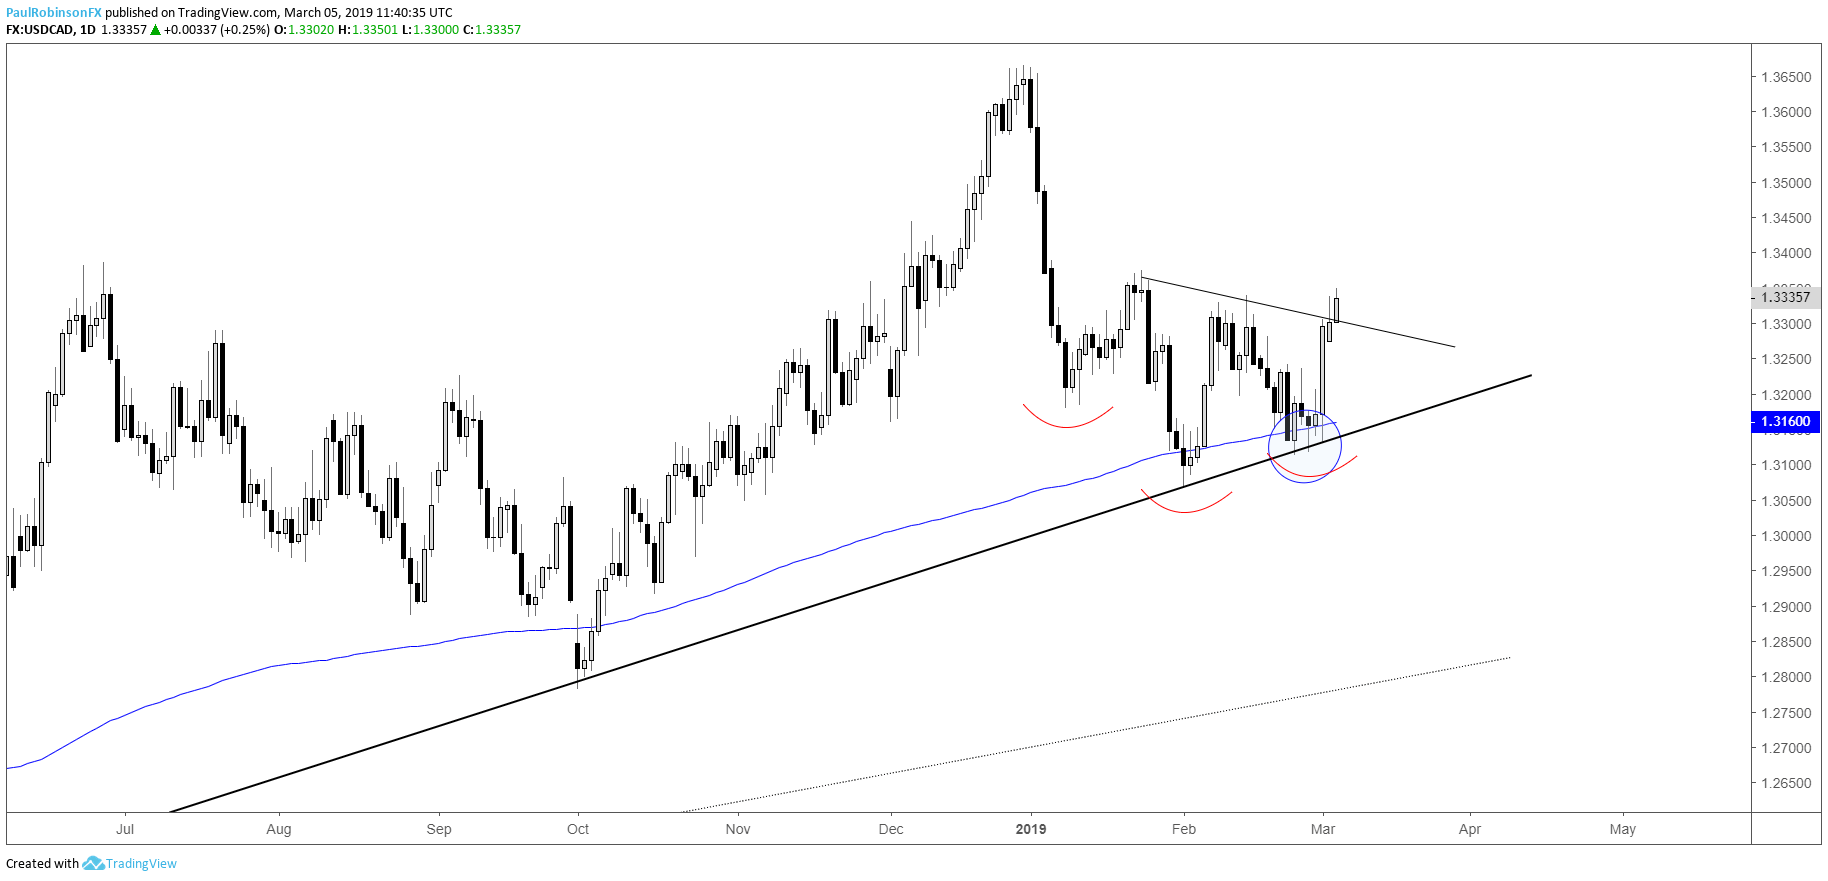
USDCAD exploded on Friday right from an important cross-road of support – Jan 2018 & 200-day MA combo. An inverse head-and-shoulders pattern is getting triggered with further strength yesterday and today. The size of the pattern and support it is coming off of suggests we may see most or all of the slide from January taken back.
USDCAD Daily Chart (Blast-off from support, neckline breaking)
AUDUSD & AUDJPY have solid technical patterns
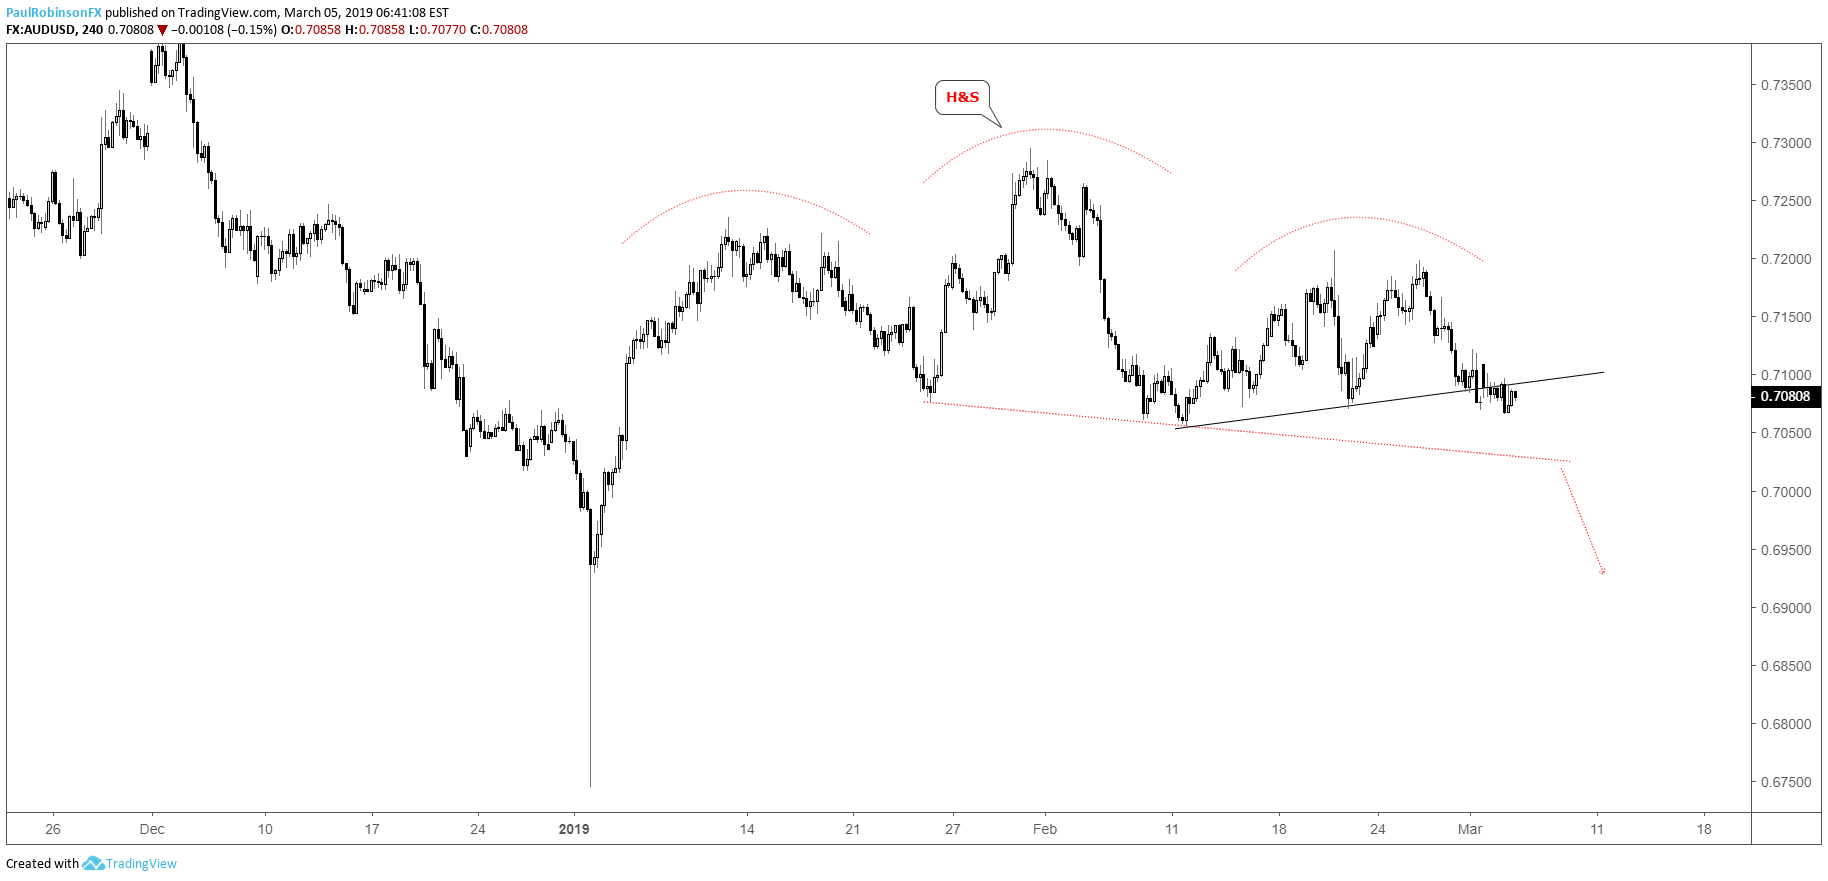
AUDUSD is weakening towards the neckline of a head-and-shoulders pattern, positioning it to go the opposite direction as USDCAD in similar fashion. A neckline break should have Aussie testing flash-crash levels in relatively short order. A break still needs to develop before we can call the pattern valid, but that looks likely to be just around the bend.
AUDUSD 4-hr Chart (neckline break will trigger H&S pattern)
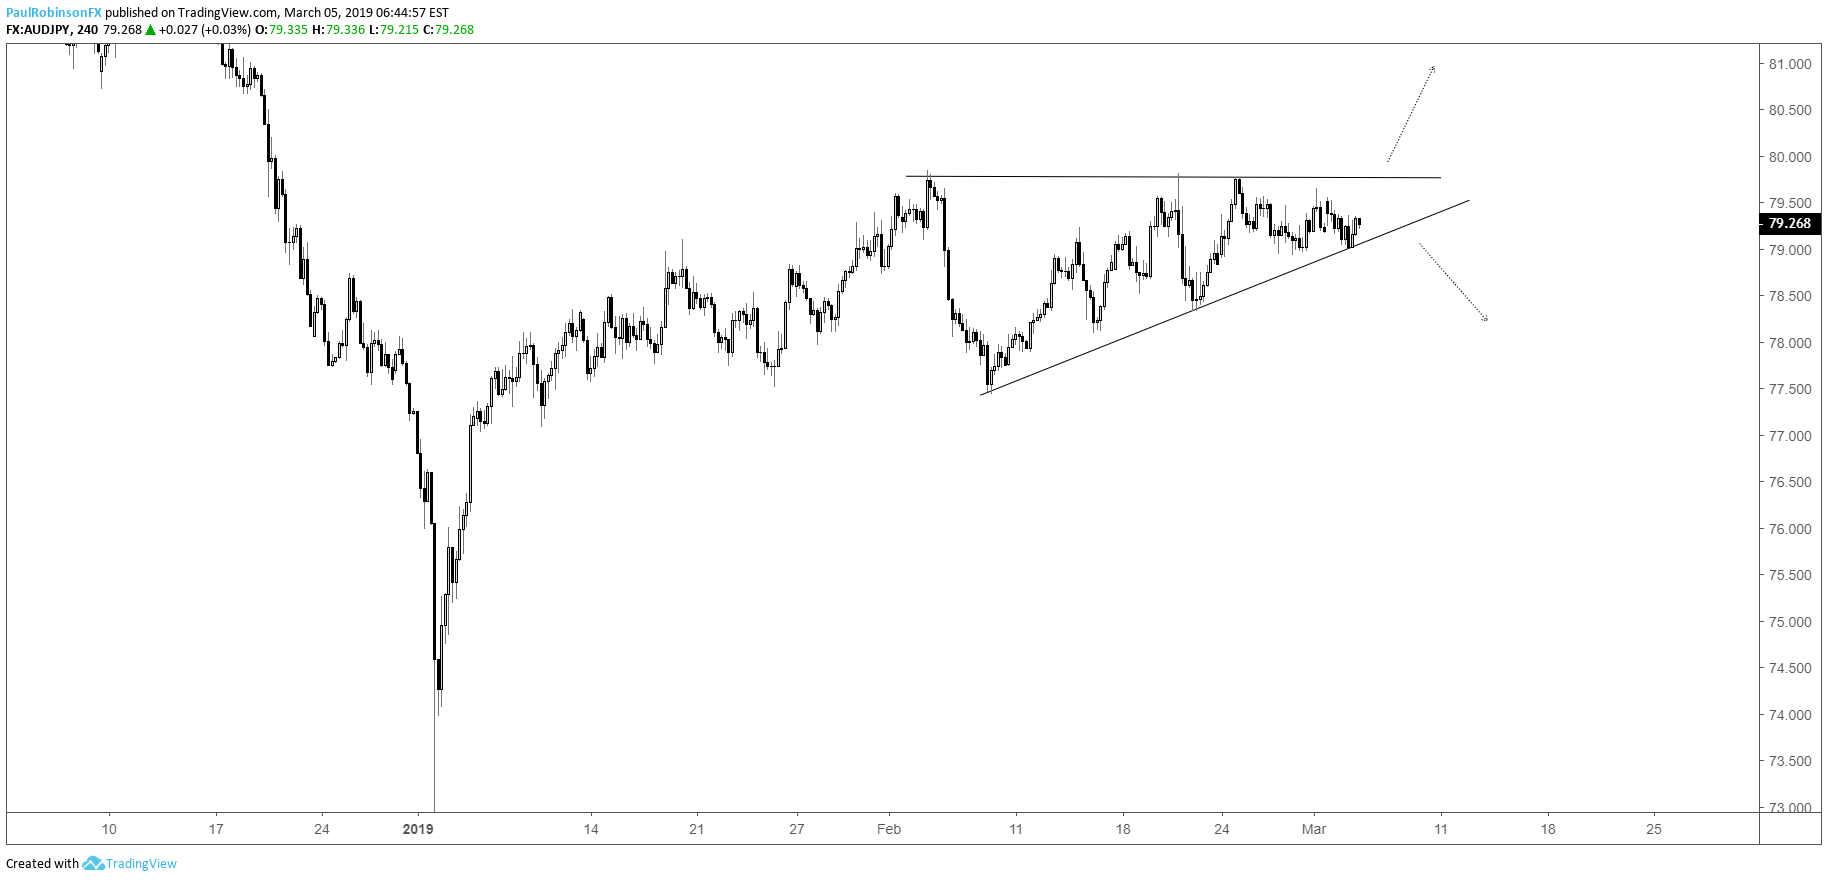
AUDJPY is nearing the apex of an ascending wedge, and with the nature of ascending wedges (higher lows) in the context of a generally bullish trend it appears likely to break to the topside. However, a downside break can't be ruled out. Waiting for the break to follow...
AUDJPY 4-hr chart (wedge nearing breakout)
Gold may post small bounce soon but sellers to remain
Gold and silver are heavy and while a bounce could develop for the sector, much damage has been done. On strength, watch how old support reacts as resistance. Overall, looking for materially lower prices in the weeks ahead.
Check out the Q1 Gold Forecast to see our analysts’ intermediate-term fundamental and technical outlook.
Gold Daily Chart (levels to watch)

Resources for Forex & CFD Traders
Whether you are a new or an experienced trader, DailyFX has several resources available to help you; indicator for tracking trader sentiment, quarterly trading forecasts, analytical and educational webinars held daily, trading guides to help you improve trading performance, and one specifically for those who are new to forex.
---Written by Paul Robinson, Market Analyst
You can follow Paul on Twitter at @PaulRobinsonFX


