


The Euro is backing down near support, may get a bounce from here or a little lower; overall though a broader bearish configuration is in the works. USD/CAD is failing to muster much strength after its fall to start the year; looking for it to trade lower. Gold is finally making a move out of a triangle and with it volatility at the least should pick up, with lower as the initial bias.
Technical Highlights:
- EUR/USD nears support, broader bearish pattern coming into view
- USD/CAD short-term price action suggests more weakness soon
- Gold breaking out of triangle, levels to watch
See where our team of analysts see your favorite markets and currencies headed in the months ahead on in the Q1 Trading Forecasts.
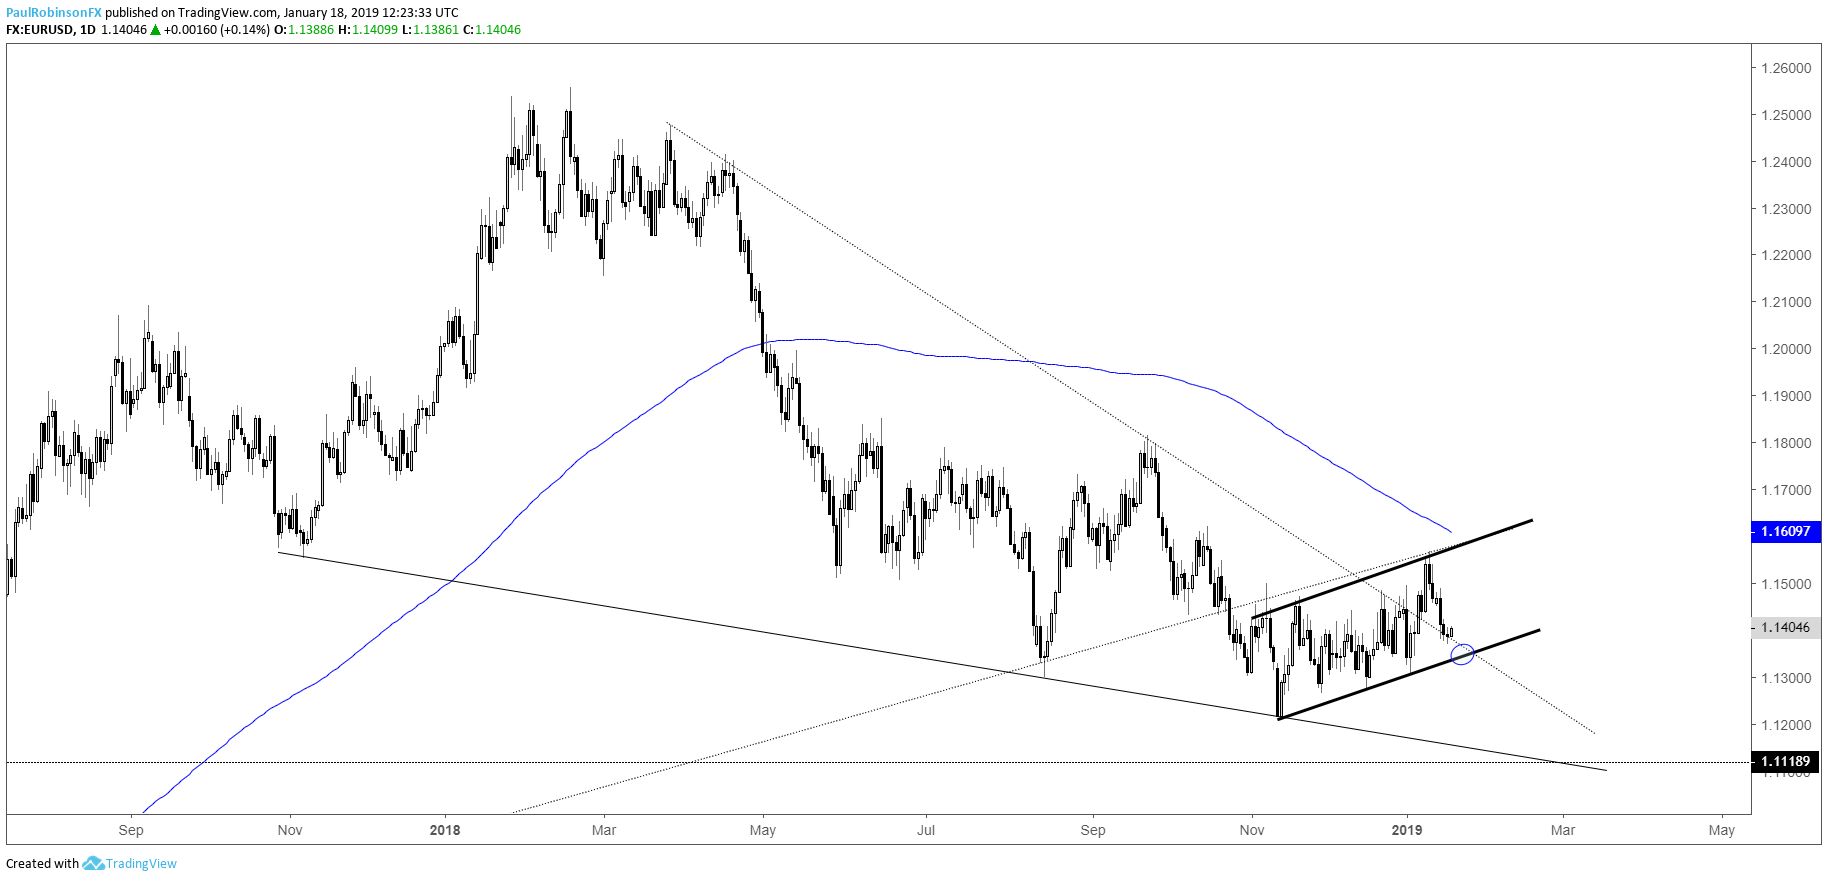
EUR/USD nears support, broader bearish pattern coming into view
The Euro is trying to come off a top-side test of a trend-line from March, but even if it does the outlook is mired by choppy price action. There is a tilt higher to the chart, but overall within the context of the broader one-year trend a bear-flag is coming into view. It won’t be validated though until the lower trend-line from November is broken.
Check out the recently released Q1 Euro Forecast to see our analysts’ intermediate-term fundamental and technical outlook.
EUR/USD Daily Chart (Broader bear-flag building)
USD/CAD short-term price action suggests more weakness soon
The plunge to start the year is failing to find any takers to push USD/CAD back higher. The tepid recovery is taking on the shape of a bear-flag and setting up for price to extend lower to the February trend-line, 200-day combo.
USD/CAD Daily Chart (Trend-line/200-day targeted on breakdown)

Check out the recently released Q1 USD Forecast to see our analysts’ intermediate-term fundamental and technical outlook.
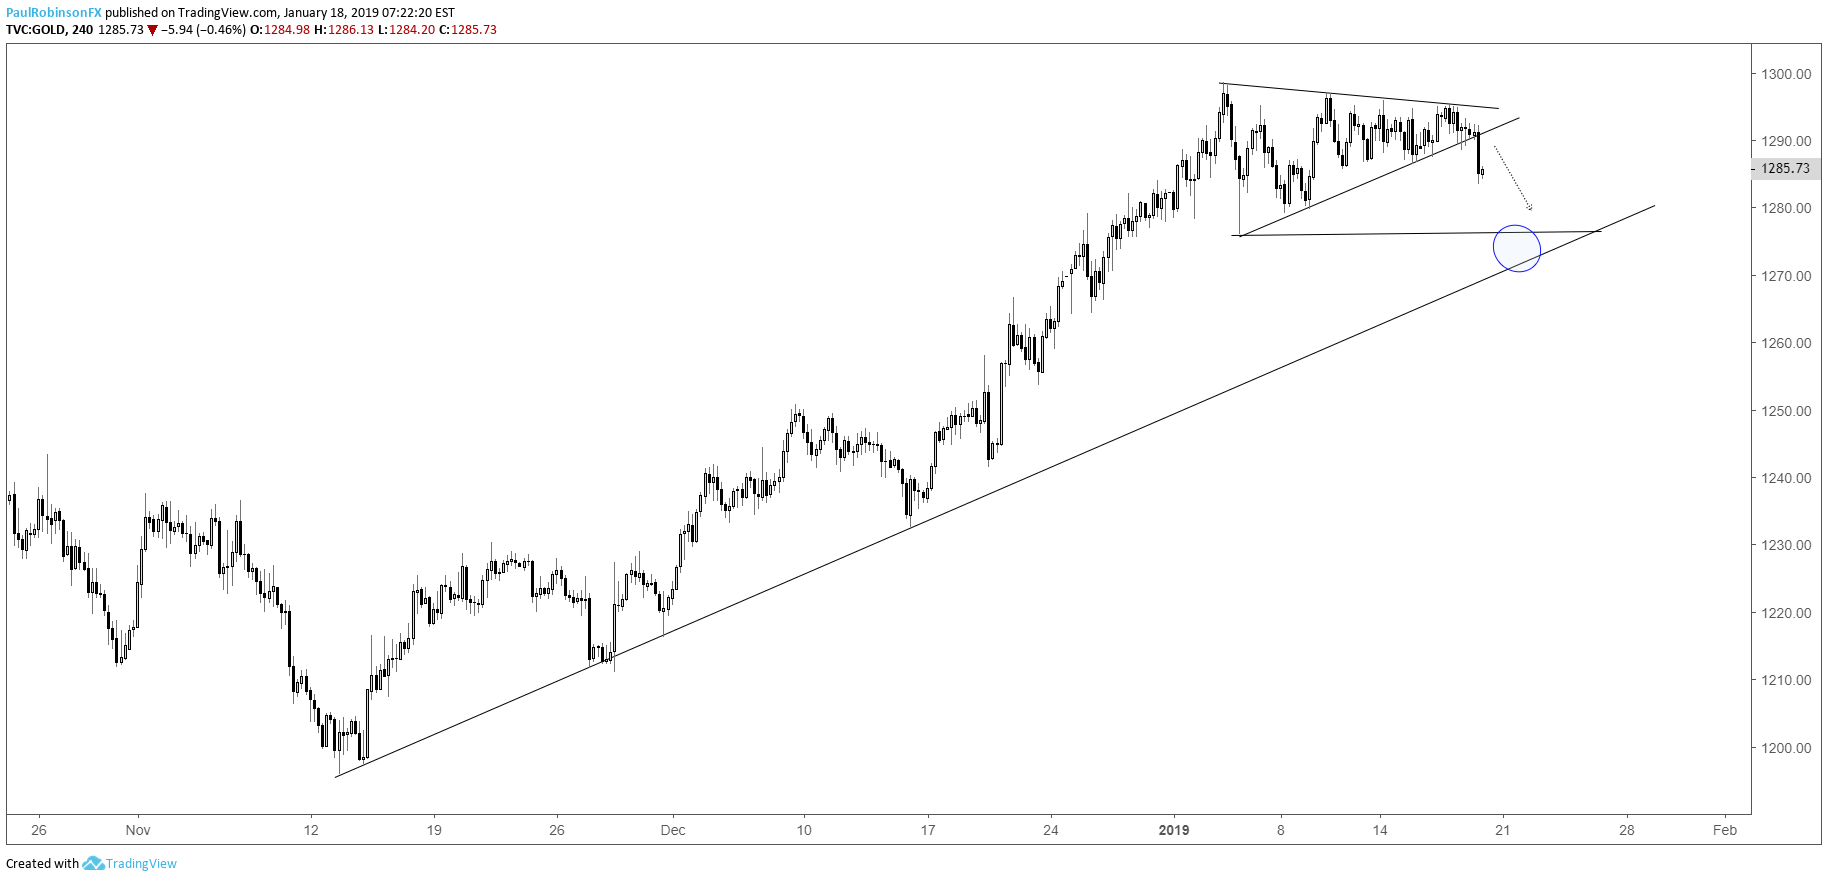
Gold breaking out of triangle, levels to watch
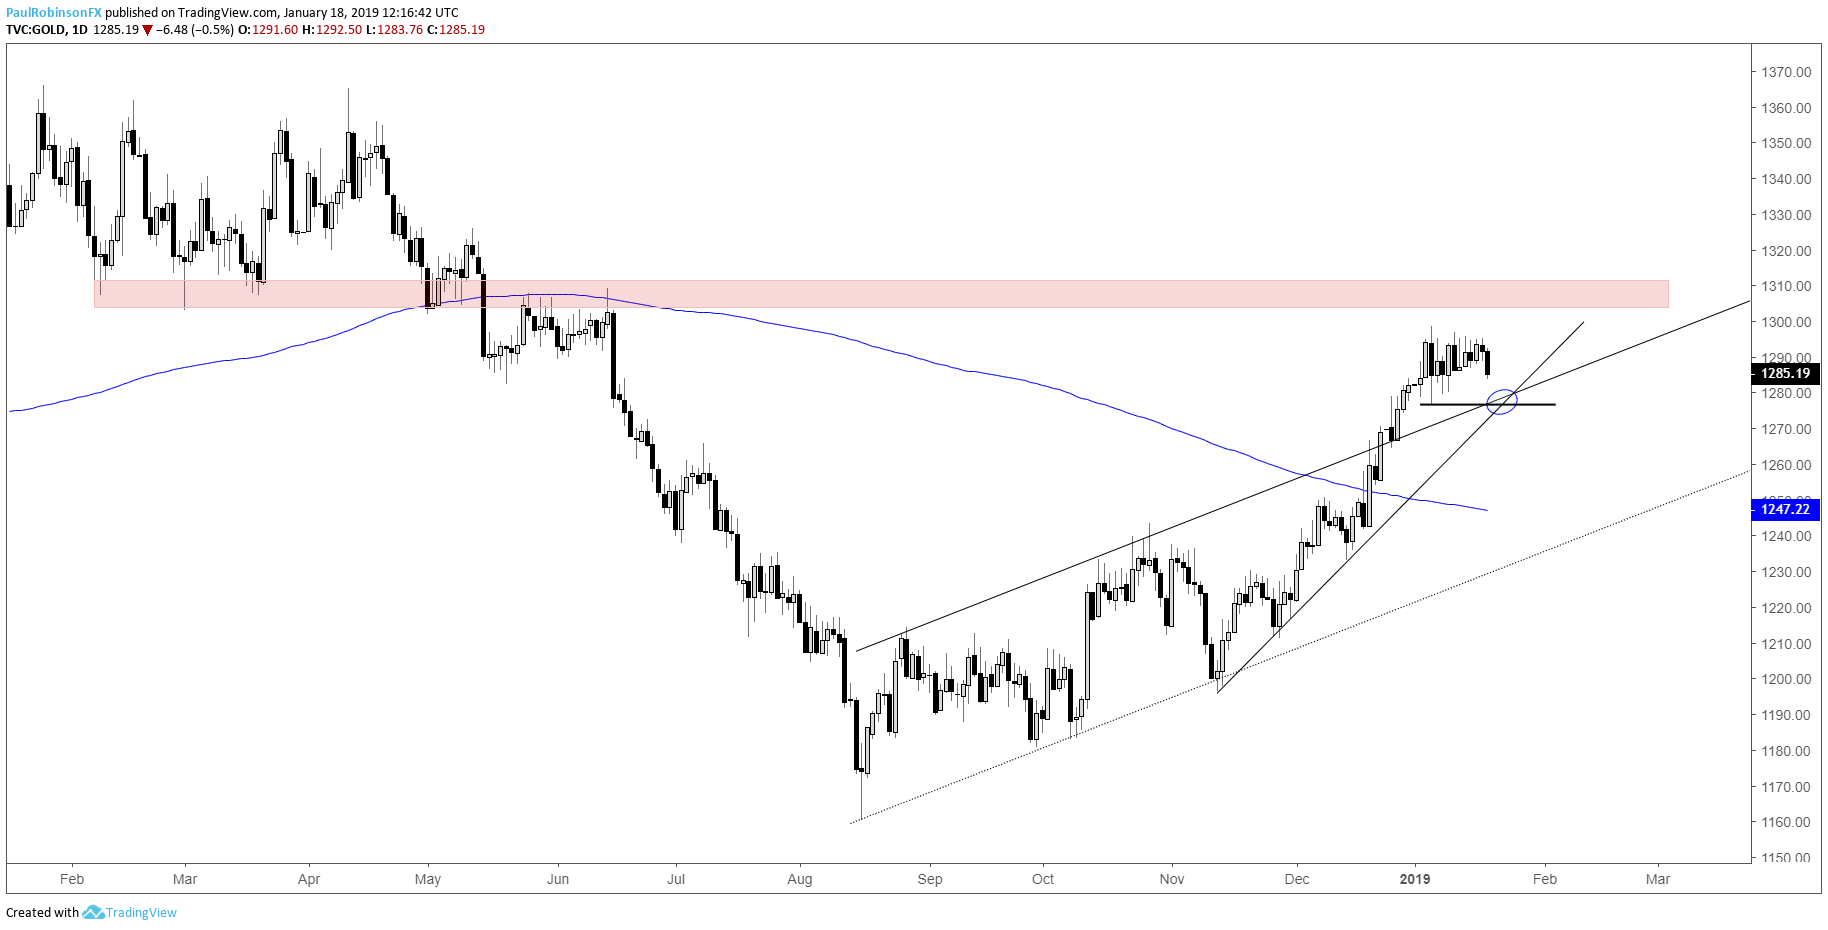
Gold is cracking down out of a triangle and headed for a test of the upper parallel dating back to the summer, along with this lies a trend-line from November and the low from the day which kicked off the development of the triangle. A break below 1276 will be needed to accelerate the move lower.
Check out the recently released Q1 Gold Forecast to see our analysts’ intermediate-term fundamental and technical outlook.
Gold 4-hr Chart (Triangle break)
Gold Daily Chart (Support in focus below)
Resources for Forex & CFD Traders
Whether you are a new or an experienced trader, DailyFX has several resources available to help you; indicator for tracking trader sentiment, quarterly trading forecasts, analytical and educational webinars held daily, trading guides to help you improve trading performance, and one specifically for those who are new to forex.
---Written by Paul Robinson, Market Analyst
You can follow Paul on Twitter at @PaulRobinsonFX


