


The US Dollar Index (DXY) is set to keep on converging as the year draws quickly to a close, may make trading limited in opportunity now but lead to a good start to 2019. The Euro may have another little move left in it if the developing triangle has anything to say for it. USD/CAD finally broke a multi-tested trend-line, keeps pressure on. Gold is rallying into resistance but if can clear has a little room to go until the next levels are met.
Technical Highlights:
- US Dollar Index (DXY) poised to congest even further
- EUR/USD triangle is working towards a narrower apex
- USD/CAD finally breaks trend support, keeps pressure on
- Gold at resistance, if can clear has a little more room to run
See the DailyFX Q4 Forecasts to find out where our team of analysts think your favorite markets and currencies are headed as the year quickly draws towards its conclusion.
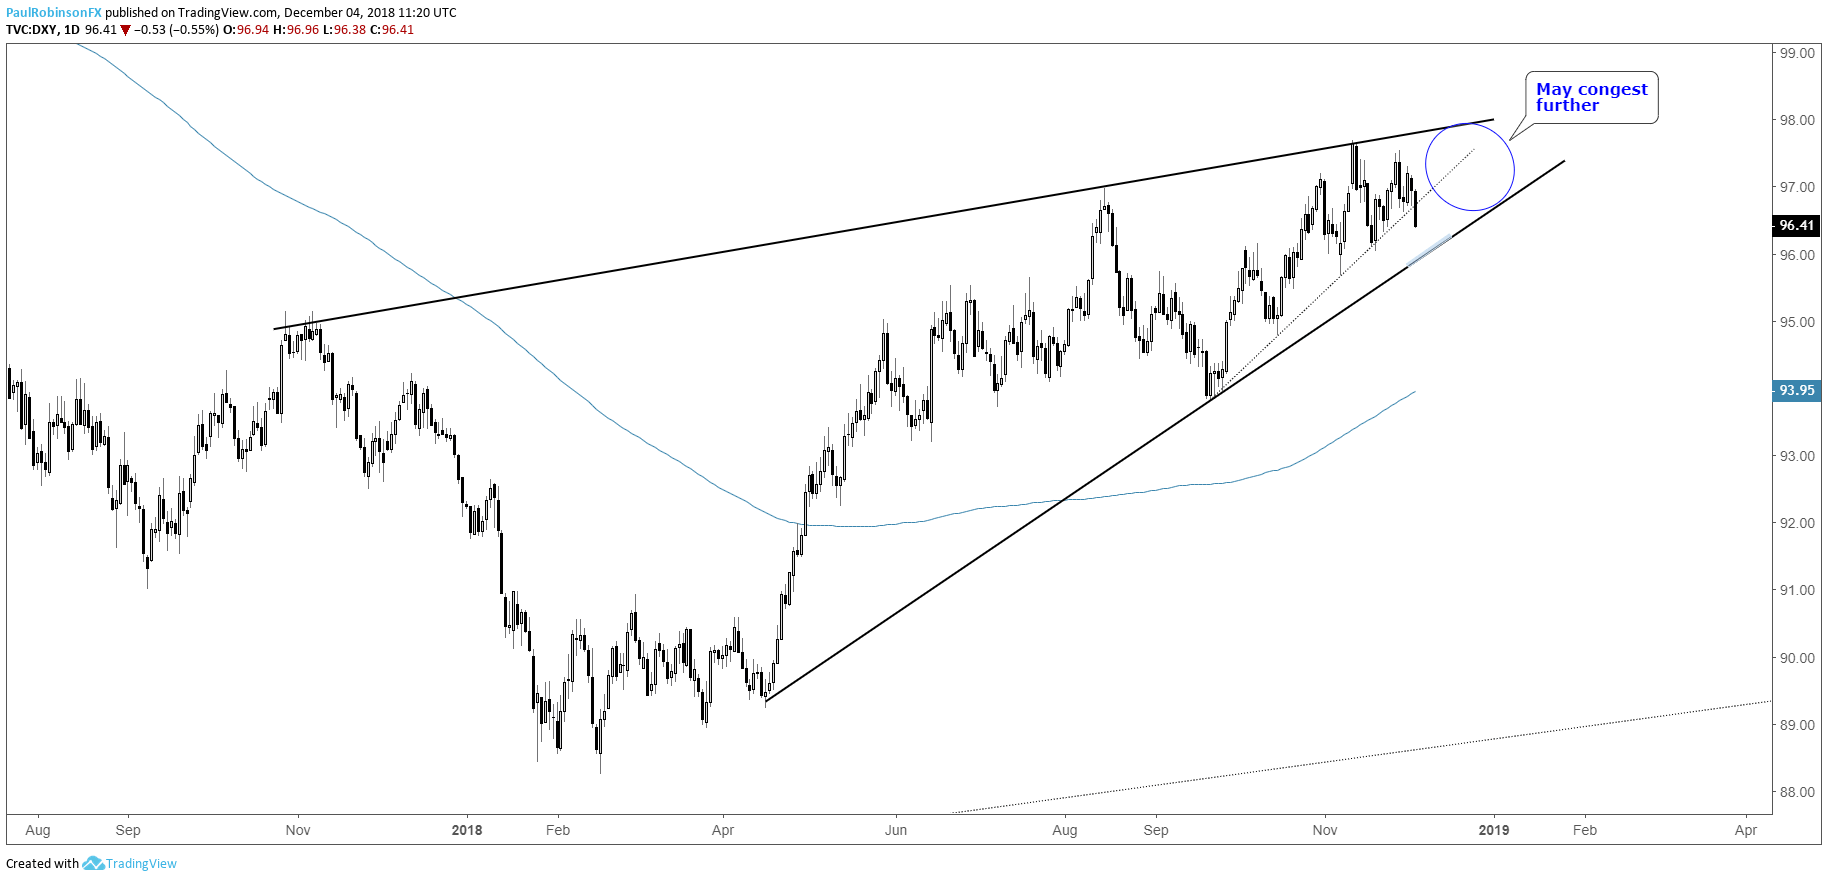
US Dollar Index (DXY) poised to congest even further
The US Dollar Index (DXY) is looking to break a trend-line from September, but even if it does there is an even more important trend-line running up from April just a short distance below. Between the top-side trend-line from November of last year and the one just below, the DXY may be set to continue congesting as the year comes to a conclusion. If this is the case then a hold of the lower trend-line may offer another small trade higher as convergence continues. While not ideal in the very near-term, could set up for an explosive situation as the calendar flips to 2019.
US Dollar Index (DXY) Daily Chart (Convergence continuing...)
See what key fundamental and technical factors are expected to drive the Dollar through year-end in the Q4 USD Forecast
EUR/USD triangle is working towards a narrower apex
EUR/USD continues to build on the triangle discussed in the weekly Euro technical forecast, and soon it should be ready to break out of the congestion pattern. Trend favors a downside break of the symmetrical triangle, but the downside may be limited as the November underside trend-line quickly comes back into play. But, as the downside may be limited, a top-side breakout is seen as being even more limited with a thicket of resistance to climb through starting just after the point of breakout.
EUR/USD Daily Chart (Building a Triangle)

See what key fundamental and technical factors are expected to drive EUR/USD through year-end in the Q4 Euro Forecast
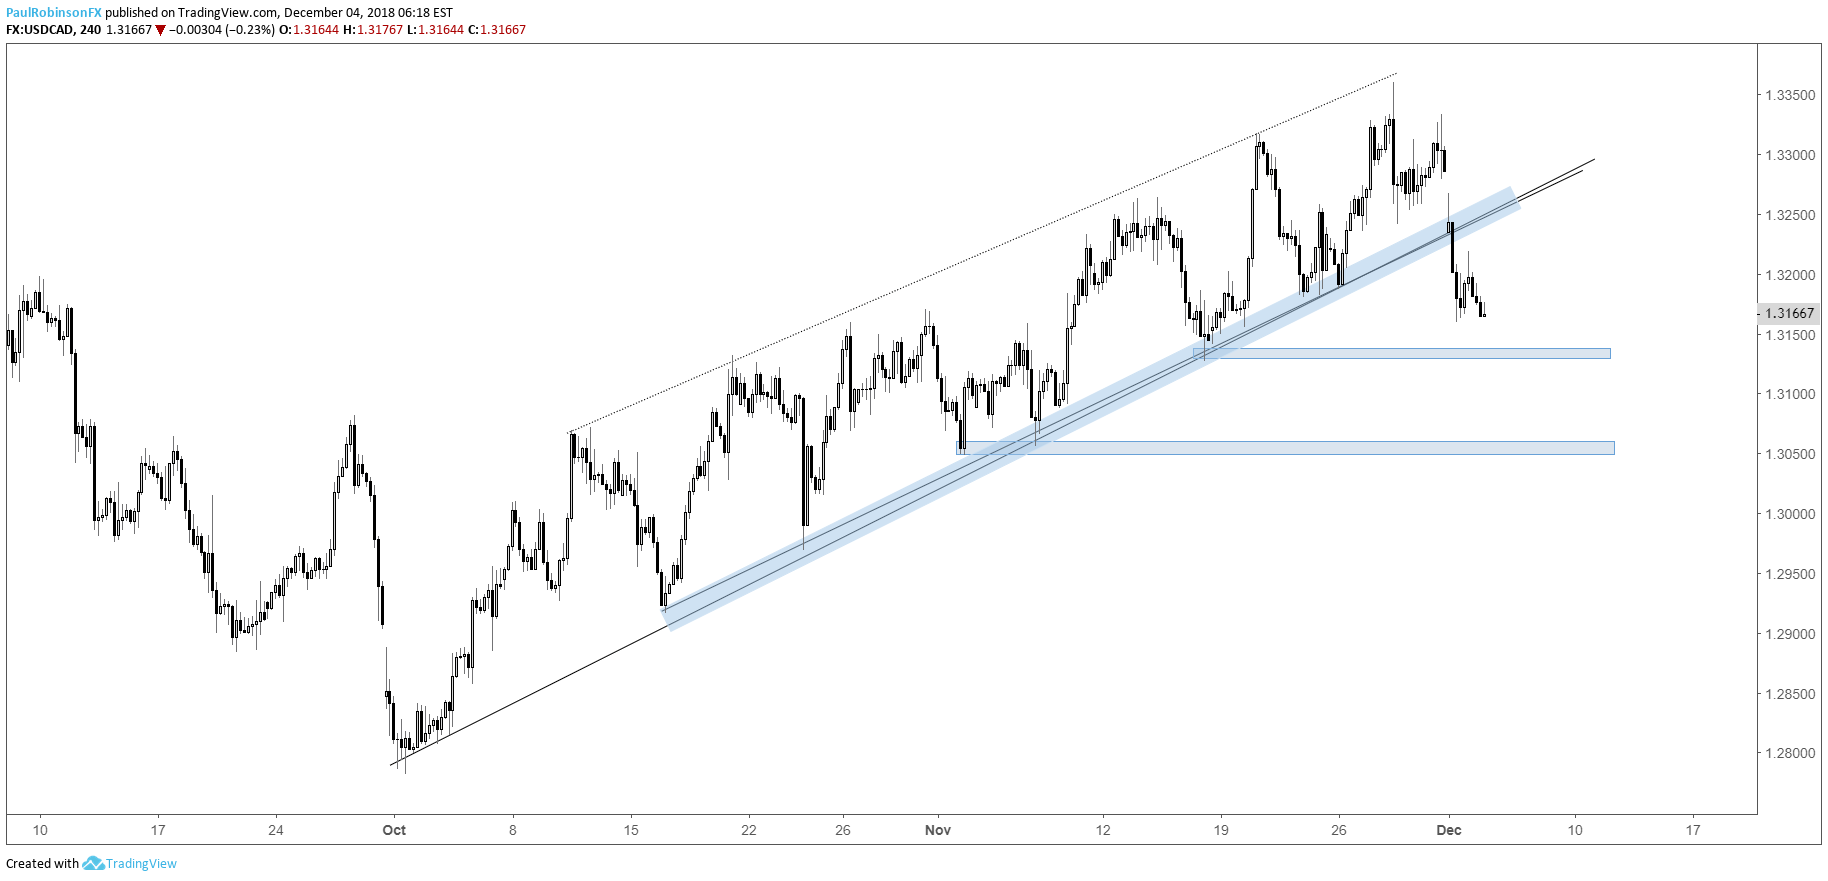
USD/CAD finally breaks trend support, keeps pressure on
Finally, after numerous tests of the uptrend line from October, USD/CAD broke it yesterday. This keeps pressure on with rallies as seen in the very near-term as likely to be short-lived. Levels of support to watch arrive around 13127, 13050, then near 13000.
USD/CAD 4-hr Chart (T-line broken, keeps pressure on)
Gold at resistance, if can clear has a little more room to run
Gold is getting a little kick to it the past couple of days, with resistance in the high 1230s, low-1240s firmly in play. Continuing higher with the trend off the August low, a breakout above 1243 should have the 200-day at 1257 and top of the rising channel (possible bear-flag) in play. A failure to hold could bring more chop and the lower parallel back into focus.
See what key fundamental and technical factors are expected to drive Gold through year-end in the Q4 Gold Forecast
Gold Daily Chart (a break above resistance keeps it trading higher)

Resources for Forex & CFD Traders
Whether you are a new or an experienced trader, DailyFX has several resources available to help you; indicator for tracking trader sentiment, quarterly trading forecasts, analytical and educational webinars held daily, trading guides to help you improve trading performance, and one specifically for those who are new to forex.
---Written by Paul Robinson, Market Analyst
You can follow Paul on Twitter at @PaulRobinsonFX


