USD/JPY is running higher after posting a higher low, and on that is now working on building a triangle formation below resistance in the mid-11400s. The Euro is trading near the important 11300-line, an important inflection point to find resolution in days head. U.S. stocks bounced to start the week but that is all it looks like this will be before another round of selling hits. Gold is continuing to validate trend-line resistance, but the fact it has yet to turn down may be a positive sign.
Technical Highlights:
- USD/JPY triangle building below big resistance
- EUR/USD testing important support around 11300-line
- Gold price struggling at trend-line resistance
- Dow Jones to weaken again after early-week bounce
See the DailyFX Q4 Forecasts to find out where our team of analysts think your favorite markets and currencies are headed as the year quickly draws towards its conclusion.
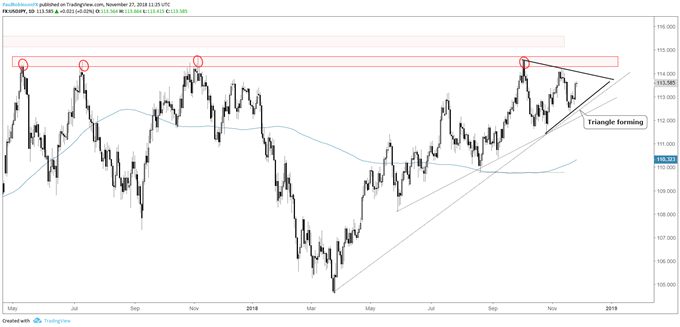
USD/JPY triangle building below big resistance
USD/JPY bouncing the past few sessions is bringing into play the possibility of a symmetrical triangle. It would come at an interesting spot as the top of the triangle is at a significant area of resistance dating back to May of last year. The pattern needs a little more time to develop but presents potential at some point for a 300 pip or so move once it finally breaks out.
USD/JPY Daily Chart (Triangle forming under resistance)
See what key fundamental and technical factors are expected to drive the Dollar through year-end in the Q4 USD Forecast
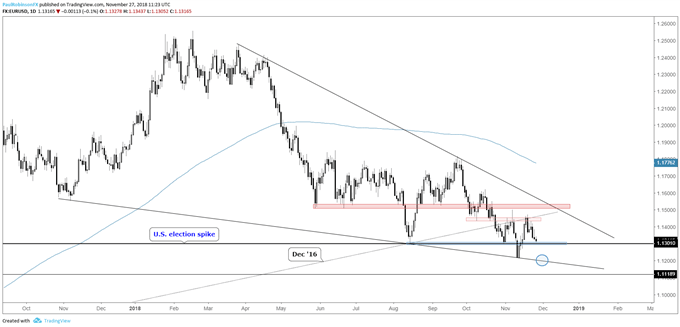
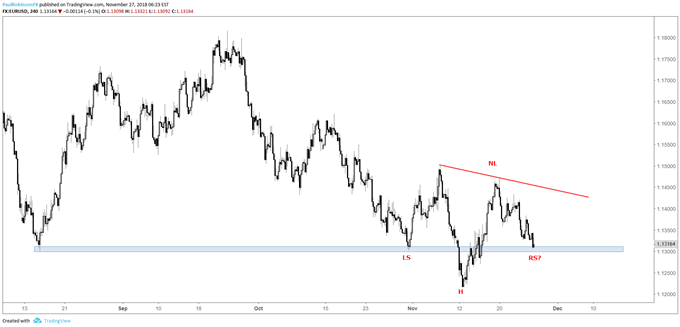
EUR/USD testing important support around 11300-line
EUR/USD is testing the 11300 line at the time of this writing. It’s a big spot which needs to hold if the Euro is to have a shot at a larger rebound off the monthly low. A possible inverse head-and-shoulders could form if a rally starts to develop soon, but a failure would have the monthly low and underside trend-line from a year-ago back in focus.
EUR/USD Daily Chart (11300-line important)
EUR/USD 4-hr Chart (Right shoulder needs to form or else more weakness)
See what key fundamental and technical factors are expected to drive EUR/USD through year-end in the Q4 Euro Forecast
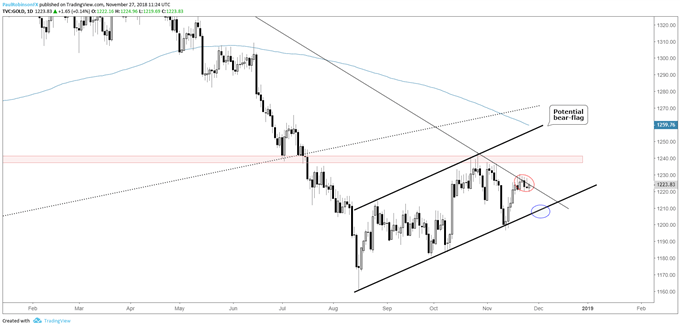
Gold price struggling at trend-line resistance
Gold is treading water right at the April trend-line, and with it not turning lower it increases the likelihood that it will trade higher. If it does, though, it won’t be long before another zone of resistance surrounding 1240 will come into play. Broadly speaking, even a breakout above all near-term resistance will still keep the precious metal in the confines of a developing bear-flag. However, it won’t be validated until the trend-line off the August low is broken.
Gold Daily Chart (holding steady at t-line resistance
See what key fundamental and technical factors are expected to drive Gold through year-end in the Q4 Gold Forecast
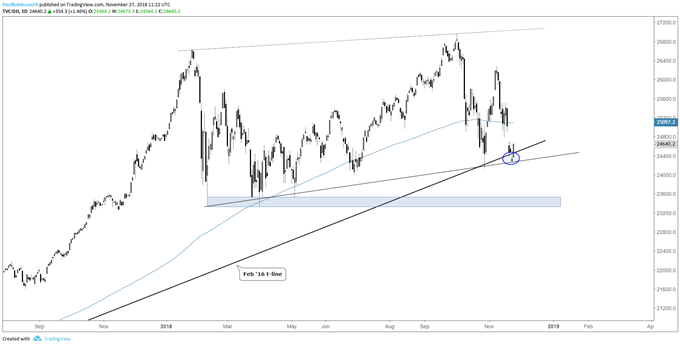
Dow Jones to weaken again after early-week bounce
U.S. stocks started the week off bouncing, but that is about all it looks like at this time. A bid isn’t expected to last long, perhaps a fill of some large gaps from last week but interest in this corner is on being a seller not a buyer. The Dow has some decent support at its feet via the Feb 2016 t-line, Feb 2018 t-line, and October lows, but with the market weak and yet to show any signs of real fear it looks like those support levels won’t hold for long. Still looking for the early-year lows down to just under 24k before a meaningful bounce may develop.
Dow Jones Daily Chart (Supported, but maybe not for long)
See what key fundamental and technical factors are expected to drive Global Stock Markets through year-end in the Q4 Global Equities Forecast
Resources for Index & Commodity Traders
Whether you are a new or an experienced trader, DailyFX has several resources available to help you; indicator for tracking trader sentiment, quarterly trading forecasts, analytical and educational webinars held daily, trading guides to help you improve trading performance, and one specifically for those who are new to forex.
---Written by Paul Robinson, Market Analyst
You can follow Paul on Twitter at @PaulRobinsonFX


