


S&P 500, Nasdaq 100, VIX, Recession and Dollar Talking Points:
- The Market Perspective: S&P 500 Bearish Below 4,100; USDJPY Bearish Below 134.00; EURUSD Bullish Above 1.0100
- The S&P 500 has recovered more than half of its 2022 tumble and the Nasdaq 100 has returned to a technical ‘bull market’, but conviction is still a question
- Where the markets have discounted significant rate hikes and economic trouble through the end of the year, it hasn’t likely fully accounted for our unique fundamental predicament

A Bull Market or a Bear Market Bounce?
There is little mistaking the charge the markets caught this past week after the US inflation update indicated a sharper pullback from its multi-decade peak rate than economists had projected. Adding some fundamental wind to the speculative sails translated into a significant market response. After an extended bout of indecision manifesting itself into the smallest week’s (5 trading day) range of the year, the S&P 500 charged 3.8 percent through the second half of the week. More than resolve the congestion, that pushed the benchmark index through the midpoint of its 2022 tumble and spurred the 20-day rate of change (the rolling monthly pace) to match its fastest pace of climb since the initial recovery from the pandemic collapse through March of 2020. Adding to this already impressive perspective, there were acute comparisons like the Nasdaq 100 officially entering a bull market (20 percent off its cycle low close) and broad ones (gains registered across the global equities, emerging markets and other assets). This market performance combined with the unflattering fundamental backdrop makes for a strong debate: is this a true return to bull market or an exaggerated bear market bounce?
Chart of S&P 500 with 200-Day SMA, Volume and 20-Day ROC (Daily)
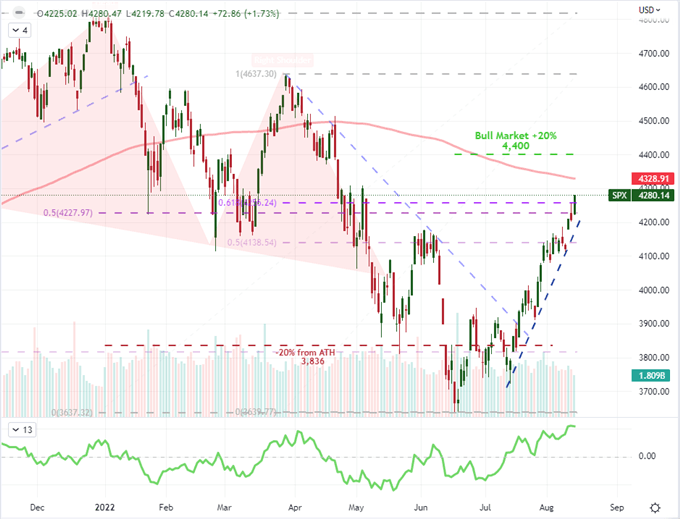
Chart Created on Tradingview Platform
It is important to distinguish what is meant by asking whether the market has committed itself to moving forward. While the technical definition for a ‘bull market’ is a 20 percent advance from an important or cyclical low, I’m interested in something more systemic in nature. My more expansive definition would be: an advance from a benchmark risk-oriented asset like the S&P 500 that can lead it fresh record highs over a reasonable amount of time (within six to nine months) without returning to new multi-year lows and sustaining its general course over a period of quarters if not years. In other words, I’m looking to determine the market’s view of our course such that it would be productive from the perspective of an ‘investor’ with a longer holding period than the short-term trader. From the poll I conducted, it would seem that the skeptical bears are more numerous, but their definition of a ‘bull trend’ may different or I may appeal more to cynics. There is no ‘right’ answer when it comes to the market’s conviction, but market participants would do well to follow the debate.
Twitter Poll Asking Whether Participants Believe the S&P 500 is In a True Bull Market
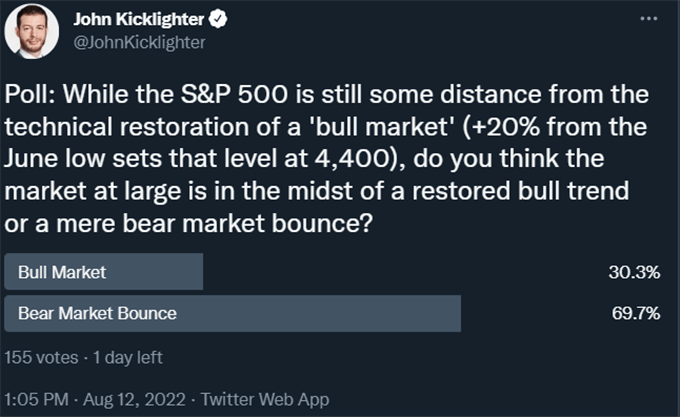
Poll from twitter.com, @JohnKicklighter
The Systemic and the Seasonal
For the market to have scaled the bullish heights it has thus far, there has been some level of discount around the fundamental risks that may still lie ahead. The scenarios that could reasonable cover includes a persistent inflation, monetary policy that is more restrictive than what we are currently pricing in and an economic retrenchment that is longer and deeper what has been projected by the various groups that are followed for such things. Given the difficulty in balancing all of these matters for the ‘soft landing’ the Fed has been reiterating, there is a good chance that the fallout has not been fully accounted for in the drop through the first half of the year. Yet, as we have seen time and again, the market’s forecasting period can change. If the fundamental toll is not to be registered until well enough into the future, speculators’ can take advantage of the interim conditions. That seems to at least be the situation at present with the VIX volatility index dropping for 8 consecutive weeks – a feat it has only managed twice before in the series’ history.
Chart of VIX Volatility Index with 20-Week SMA and Consecutive Week Count (Weekly)
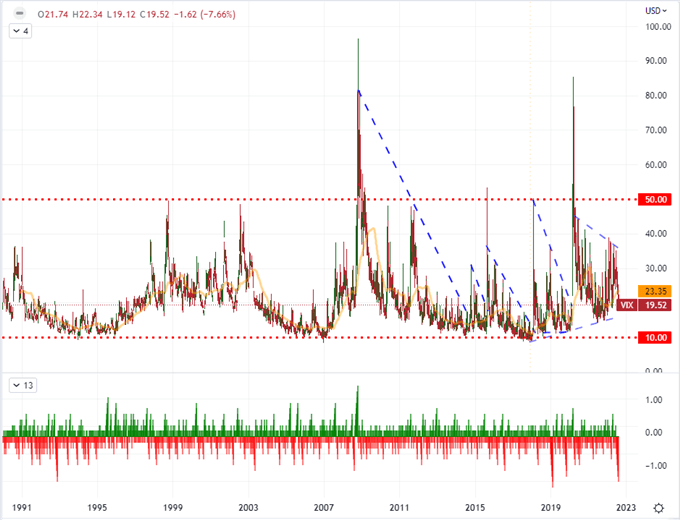
Chart Created on Tradingview Platform
At just below 20, the VIX is certainly not at an extreme in its historical range. That said, the level of contentedness to steadily deflate the caution registered in the hedging reflected by this derivative of the S&P 500 index is stark. There are plenty of current systemic threats that can upend the stability of the markets moving forward. Yet, the unpredictability of the trend in event risk moving forward combined with the even more capricious tolerance for bad news may render seasonal norms the more practical tide change. As I have been highlighting over the past weeks, we have passed the typical low point of volatility for the average trading year. That absolute lull is usually the 29th week and the 31st week is frequently the time frame for which volatility averages a lurch higher into accelerating fall volatility. We are entering the 33rd week of the year and the low doesn’t seem as if it has been put in yet. Of course, this is a historical average we are referring to; but if markets can find influence from these trends when it is convenient to them, it can also prove the seed of their worry.
Chart of VIX Volatility Index for 2022 YTD and 2021 Overlaid with Weekly Average (Weekly)
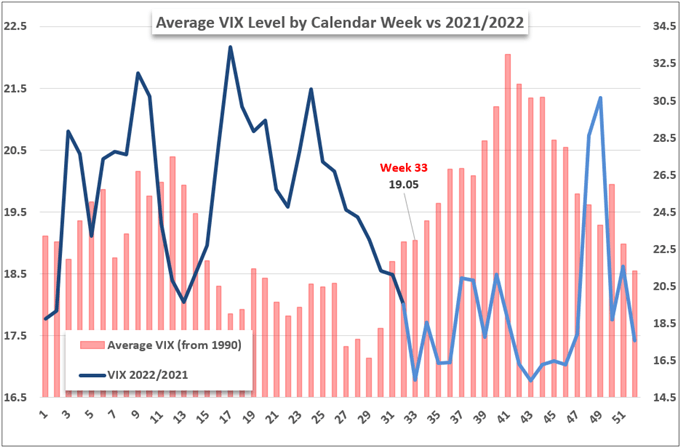
Chart Created by John Kicklighter
Top Event Risk for the Week Ahead and the Macro Barometer
Sentiment for an entire financial system is a messy and often irrational standard to establish, but it can be tested at fairly measurable intervals through high profile event risk (high profile as it will register on the greatest number of traders’ radars). Thematically, fear over the scope of recession is the end point that I believe will have the most sway in the long run. As a direct reflection on economic health, there is a run of data that can trace directly to key country’s strength. At the start of the week Japan’s 2Q GDP and a run of July data from China will give insight into the major Eastern economies. The Euro-area’s ZEW economic sentiment survey is a conveniently targeted update. Then there are measures like US retail sales, industrial production and housing starts which offer insight into the largest economy. All of that accounted for, I believe the earnings updates from Walmart, Home Depot and a few other major corporations may offer better overall insight into our course.
Global Calendar of Top Macro Economic Event Risk for the Coming Week
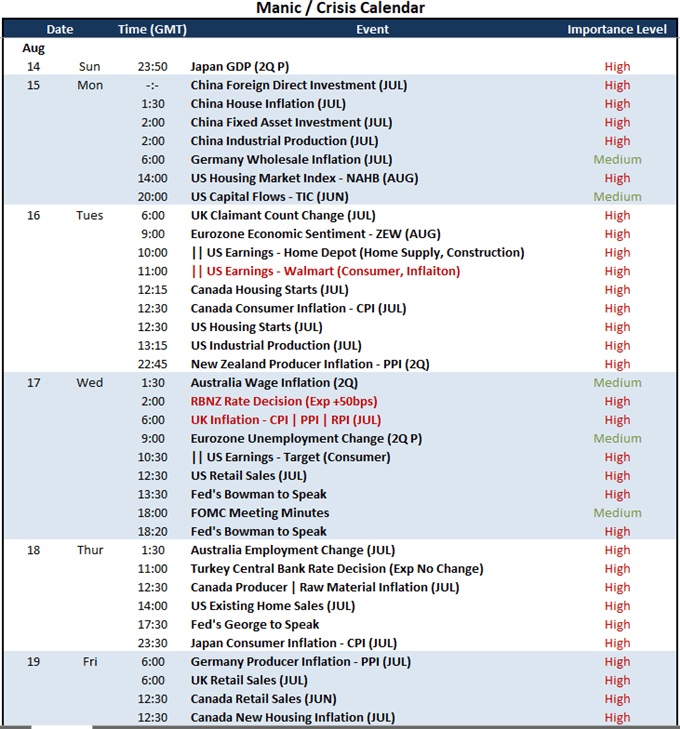
Calendar Created by John Kicklighter
While the probability and intensity of recession for the world economy – or certain key economies – is where I believe many fundamental lines will eventually terminate, there are interim issues that may stir a fundamental response without so much certainty. The persistence of inflation beyond tolerance levels, monetary policies that can suppress economies and financial markets, and regional safe haven capital flows are just a few second order themes that can move the planets out of alignment. To gauge what issue is outstripping the others, I will keep a wary eye on the US Dollar in its role as a safe haven, a currency for a hawkish policy group and an exacerbate of commodity inflation worldwide. While the Greenback slipped below its 50-day moving average this past week, it didn’t seem to fully turn on the bear taps and perhaps that is owing to the unrelenting expectations for rate hikes moving forward – a 45 percent probability of a 75 bp rate hike on September 21st and interim peak high of 3.75 – 4.00 percent range by May of next year.
Chart of DXY with 50-Day SMA Overlaid with Fed Funds Implied (Daily)
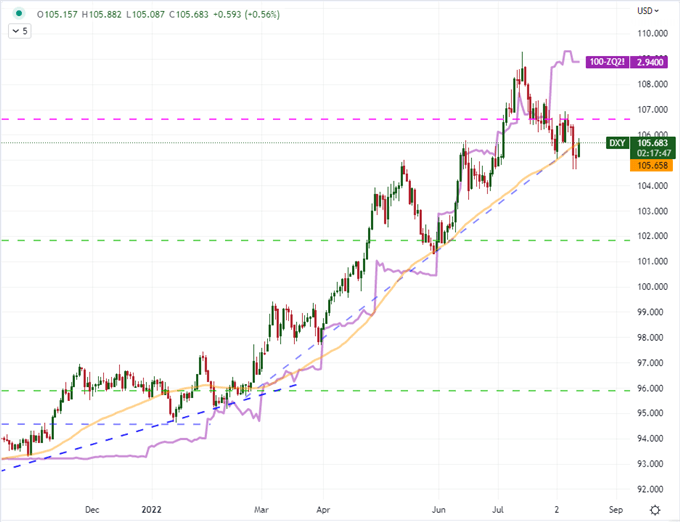
Chart Created on Tradingview Platform


