


S&P 500, VIX, Seasonality, China, Earnings, Fed, BOC and RBNZ Talking Points:
- The Trade Perspective: S&P 500 Bearish Below 4,075; USDJPY Bearish Below 134.00; EURUSD Bullish Above 1.0100
- The S&P 500 has worked its way into a notable range while expected volatility readings slow to suspiciously low levels and key event risk approaches
- Top event risk today is not the run of rate decisions from the BOC, RBNZ and BOK but the US CPI which markets seem acutely focused on

A Key Event Risk Approaches and Markets are Ill-Prepared
The US CPI is an unmistakable fundamental threat on the horizon; but to truly appreciate what kind of impact this event can have, it is important to recognize the state of the market heading into the event risk. There is a tenuous ‘peace’ that has been kept in the markets between the assumptions of seasonality, the distraction of expected event risk and the latent hope of possible improvement of trend from seriously failing fundamental themes. While it is not pre-ordained, we are heading into yet another confluence of circumstances that could potentially override the assumptions of stability in July and the 28th week of the year to restore the larger ‘risk off’ trend dominating 2022. While there are more vulnerable markets to unfavorable turns, my attention remains honed in on the US-based S&P 500. The -0.9 percent slip this past session was not extreme by any measures, but it brought us back the border of a symmetrical wedge. Meanwhile, volume is edging up from last week’s 2022 lull and the backdrop of net speculative futures positioning still rings with the most bearish view since the pandemic.
Chart of S&P 500 with Volume and Net Speculative Futures Positioning (Daily)
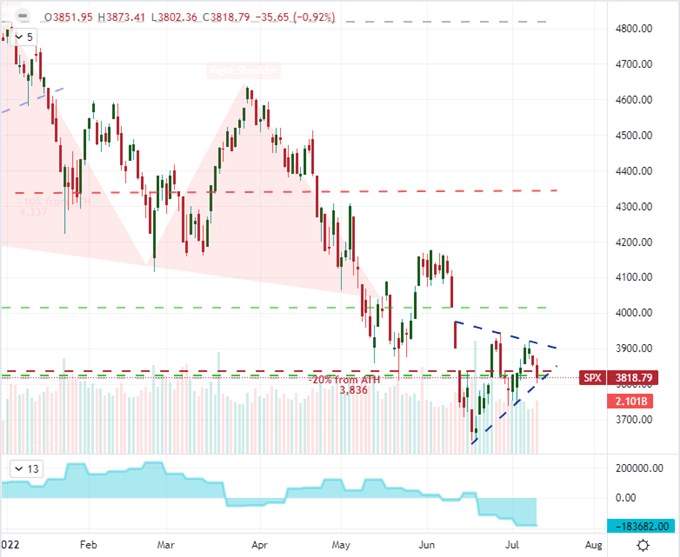
Chart Created on Tradingview Platform
Looking beyond the surface level measures of price, the market backdrop looks like an environment ripe for problems. The net speculative futures positioning clearly raises the issue of something amiss in traders’ expectations, but there are more fundamental troubles at hand. On a global macro level, I have been monitoring the relationship between the S&P 500 and global stimulus for years as an unsustainable engine for speculative exuberance. As that tide recedes, we are seeing the serious reefs that are being exposed from excessive exposure to recession fears. Some trigger – whether visible from far off or wholly of the radar – will eventually trigger the larger avalanche; but too much importance is placed on the spark and not the pool of fuel that is waiting for its ignition. Open interest and net speculative positioning show serious problems, but I believe the general view on implied (expected) volatility gives another tracer worthy of our attention. While there has been a pullback in the VIX volatility these past few weeks in line with seasonal expectations, the ‘resting rate’ of the activity gauge is historically very high. Don’t underestimate what this backdrop can do to spur a scenario in which market participants could eventually say ‘this time was different’.
Chart of VIX with 20-Week Moving Average (Weekly)

Chart Created by John Kicklighter
Recession Fears are Justified, But Their Readings are Not Direct to Source
There are always serious fundamental themes – bullish or bearish – that carry great weight on the global financial system but are otherwise overlooked because they cannot rouse the masses behind a clear banner. As of right now, the risk of recession is just such a threat. This past session alone, there were a string of reports that suggested a contraction in the US was a very high risk. The NFIB small business sentiment survey expectations component hit an all-time low of 89.5 while the IBD’s economic sentiment reading lurked at 38.5 for its 11th straight month in pessimism (a reading below 50). From the market’s perspective, the US 10-year to 2-year yield spread remains inverted, but the more surprising move was a drop in commodity prices seemingly reflecting a sharp deterioration in expected demand. Crude oil a painful -7.9 percent that could be linked to supply fed by SPR sales, but that would not be a lasting support. Meanwhile, the drop in copper and cotton (as well as other ‘softs’) don’t offer the same convenient explanation.
Chart of US Crude Oil with Volume, 200-Day SMA, 1-Day ROC and Net Spec Positioning (Daily)

Chart Created on Tradingview Platform
While I will be watching the market’s pricing of economic troubled moving forward, it is important to watch the scheduled fundamental sparks that could kindle the broader fire. There is a UK GDP and growth forecast measure due in the upcoming session, but this update pales n comparison to the impact that the Chinese 2Q GDP release could have on the global financial system. Speaking of China, the performance of its markets will be critical to monitor a worries over a return to Covid lockdown converge with financial liquidity concerns. A more disaggregated theme that should not be overlooked for its macro credentials is the start of US earning season. Pepsi managed to beat expectations this past session, but the beverage company doesn’t hold a candle to the kind of macro insight expected from JPMorgan, TSM or Conagra.
Global Calendar of Major Macro Economic Event Risk for the Next 48 Hours

Calendar Created by John Kicklighter
The Potential of US CPI and the Dollar
While this past session could largely be described as a holding pattern heading into major event risk – the US inflation report – the Dollar was still running under power. Though the Greenback’s advance was a mere drift Tuesday compared to the previous day’s rally, it was enough to notching the first breach of ‘parity’ for the EURUSD in two decades. The fundamental tail winds are heavy for the US currency whether the measure is relative yield advantage, growth comparison or outright haven appeal. Yet, regardless of dimension, I believe this benchmark has been stretched. The very overt technical bounce at such a critical, psychological level is not likely coincidence. It is absolutely possible that the consumer inflation reading outstrips forecasts and further adds to the US rate advantage, which in turn could build a trend below 1.0000. That said, I believe the more potent impact would be an unexpected (according to the NY Fed’s inflation expectations and numerous surveys) ebb in price pressures that triggers a Dollar retreat. Regardless of outcome, though, the market is distinctly tuned in. This past session, the Labor Department felt it necessary to announced a fake leak of the June CPI was indeed fake. Normally, there would be no need to deign a response; but the markets are clearly concerned.
Chart of EURUSD with 20-Day SMA with ‘Differential’ Between Spot-20SMA (Daily)
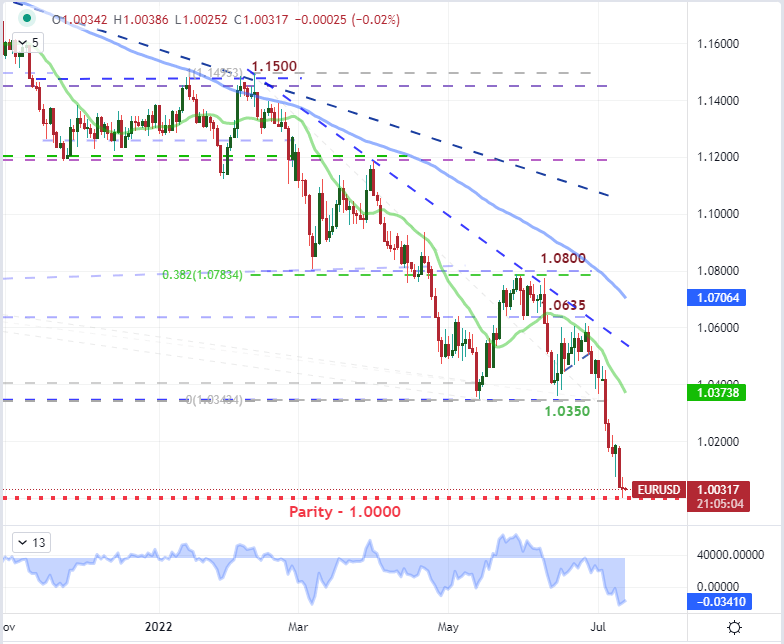
Chart Created on Tradingview Platform
The general positioning of the Dollar versus its benchmark counter, the Euro, is remarkable. EURUSD has pushed to a multi-decade low which has pushed the DXY trade-weighted Dollar Index to an equivalent high. Yet, this isn’t the only remarkable pressure from the US currency. Against its second most liquid counterpart, the Japanese Yen, it is pushing a 24 year high. Further, against the third most liquid peer in the British Pound, we are less than 500 pips from a 37 year high. In general, the Dollar is very expensive in historical terms which can create serious systemic issues such distorted capital flows, financial troubles in divergent global policies, charged inflation and deflated earnings among other issues. So, while most are monitoring the daily ebb and flow of the Greenback for trade purposes, don’t overlook the systemic matters just a little further out.
Chart of DXY Dollar Index with 1-Day ROC Overlaid with Fed Fund Forecast for 2022 and 1H 2023 (Daily)
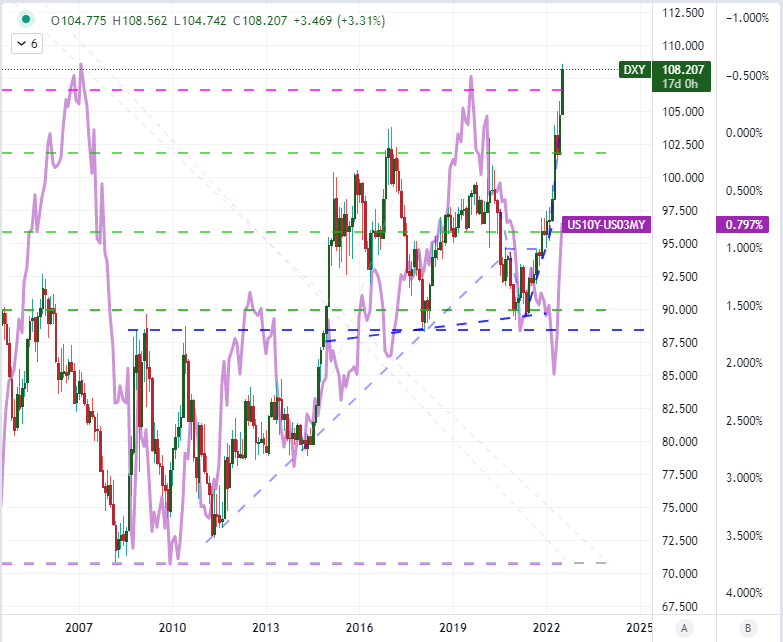
Chart Created on Tradingview Platform


