


Markets struggled to start the week as concerns for Chinese markets overrode the quiet Monday docket. Ahead, US inflation statistics and global data focused on economic health threatens to ignite volatility warped by thin liquidity.
S&P 500, VIX, Seasonality, China, Earnings, Fed, BOC and RBNZ Talking Points:
- The Trade Perspective: S&P 500 Bearish Below 4,075; USDJPY Bearish Below 134.00; Long NZDCAD Above 0.8050
- A quiet start to the week from the economic docket amplified the impact of low liquidity, systemic themes and unexpected headlines out of the China
- Top event risk ahead is the US consumer inflation expectations statistics, an indicator that feeds into a critical risk theme – rate forecasts – and the Dollar’s push to two-decade highs

A Not So Quiet Start to the Week
If you were going by the economic calendar, this week was due to start off exceptionally slow. Between the very light Monday data listings and the ‘summer doldrum’ conditions, it was a better backdrop for an uneasy loitering until some of the heavier event risk started to hit the headlines latter in the week. While the anticipation for Wednesday’s CPI, Thursday’s earnings and Friday’s Chinese GDP certainly carries its clout; thin liquidity has a tendency to amplify developments both expected and unexpected. This past session, there was unusually disparaging news from the Chinese markets which in turn triggered an amplified response from benchmark assets due specifically to the shallow market depth. Overall, the results was a broad ‘risk aversion’ response from the financial system; but as was evidence in the S&P 500’s -1.2 percent drop, it wasn’t the kind of move that would reshape the entire technical structure. There remains plenty of harbor from assumptions of systemic trend changes, but the ingredients are in place for full transition should the right catalyst hit the right chord. Just take a moment to appreciate the net speculative futures positioning for the SPX, leaning into its heaviest bearish view since the pandemic.
Chart of S&P 500 with Volume and Net Speculative Futures Positioning (Daily)
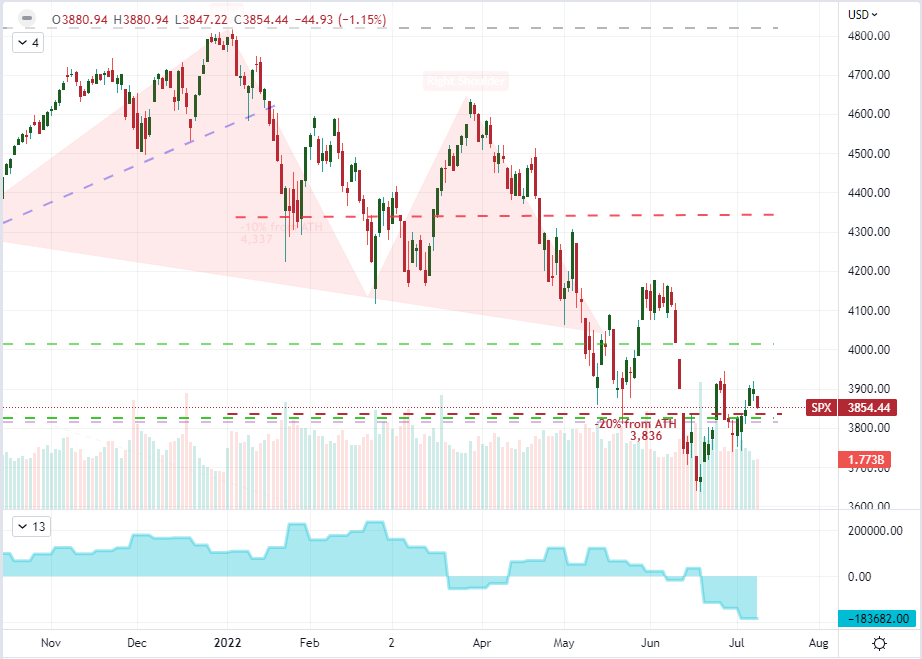
Chart Created on Tradingview Platform
As we have been talking about on a daily basis for the past week, there remains two strong forces that are not exactly contradictory to each other: systemic fundamental themes and the distortionary liquidity situation. On the former front, I believe attention is increasingly honing in on two principal matters: monetary policy bearings and the probability of a recession. Should the outlook for either change materially through an economic update or unexpected headline, the fallout in price action could be severe. Yet, it is the shape of the horizon via market conditions that matters more to me than anything else in the probability web. We have entered the 28th week for of the calendar year which is historically the fourth most reserved period (on this time frame). If you have been monitoring the level of turnover in the S&P 500, there is a distinctive slump in activity relative to the past month; but we remain significantly more active than similar periods in previous years. Remember this perspective of a significantly higher resting rate of volatility, because it is can represent a very significant running start to volatility.
Chart of Average Weekly VIX Performance
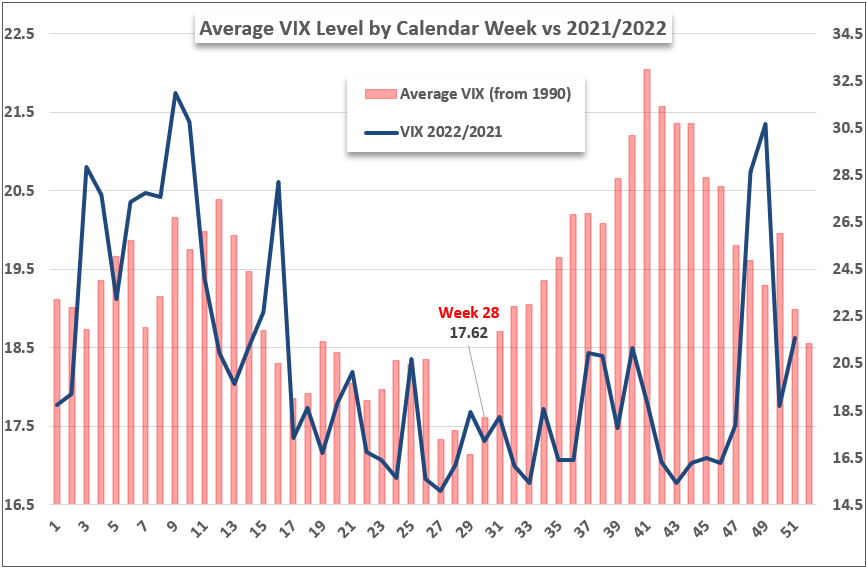
Chart Created by John Kicklighter
The Economic Backdrop – China’s Warnings and a US Recession Barometer
Between the two dominant fundamental themes on my radar – monetary policy and recession threats – it is the general health of the global economy and its principal nodes that represents the ‘end of the fundamental line’ for market perception. Unfortunately, the health of the economy and the designation of an official recession are very abstract for most market participants. Yet, the swoon is made more tangible when official data prints or the high fliers are humbled. Through Monday’s session, we were presented with the later scenario. The Chinese capital market has proven one of the best overall performers amongst the major financial centers with a rally from May that nearly restored the prestige of a ‘bull market’. The -1.3 percent slip this past session creates problems and the fundamental motivation makes a bullish outlook almost impossible to entertain. It was reported at the start of the week that Alibaba and Tencent – two of China’s largest market components – were slapped with anti-monopoly fines. Coming with heavier dispute from State-sanctioned media, there were also reports of protests at a hand full of banks that were not returning capital on deposits made by certain clients. It would be prudent to assume the Chinese government will not let the fear of a run on banks spread, but it is a risk to watch nevertheless.
Chart of Shanghai Composite with 1-Day ROC Overlaid with Hang Seng and Alibaba (Daily)
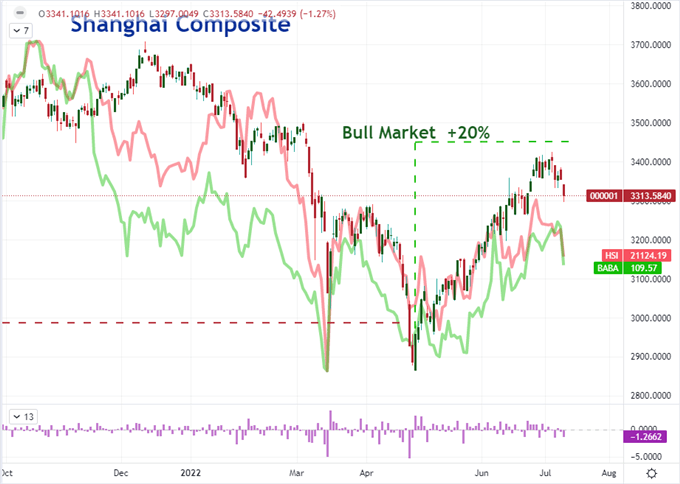
Chart Created on Tradingview Platform
When it comes to the health of the economy, there are very few economic indicators that could be reasonably expected to lead our views of the global system. China’s internal struggles are a particularly poor read to extrapolate from consider the government actively scrubs its data and there is a firewall between the country and rest of the world. On the other hand, the US economy is inextricably plugged into the globe. That said, one of the few timely market measures considered a direct read on growth – the US 10-year to 2-year Treasury yield spread (or ‘2-10 spread’) – furthered its inversion this past session. While it wasn’t a significant extension to last week’s flip, which is itself considered an ominous recession signal, we still saw the 2-year post a premium relative to its standard medium-term benchmark not seen since the beginning of 2007. That is not a good reference point in history. It increasingly look like a recession is on the horizon, the questions now is how quickly we can pull out of the funk and whether we can minimize the damage from the inversion in the meantime.
Chart of US 10-Year to 2-Year Treasury Yield or ‘2-10 Spread’ (Daily)
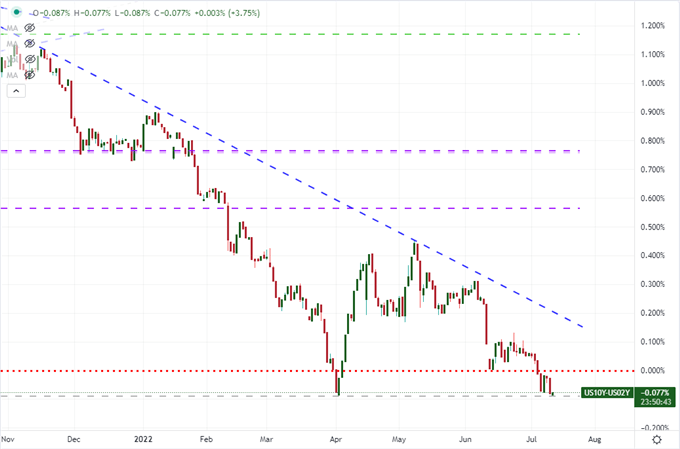
Chart Created on Tradingview Platform
Fundamentals: The Themes and the Event Risk
While Monday was thin on high-profile, scheduled releases; there is a significant increase in meaningful releases due to hit the wires moving forward. On the ‘recession’ side of the coin, there are a number of data points for which economy watchers should be mindful. The Chinese 2Q GDP and US University of Michigan consumer sentiment survey due on Friday are top billing for the entire week; but there is plenty of meaningful fodder for market participants to ingest over the next 24 hours alone. Aside form the consumer and business sentiment surveys from Australia and economic sentiment measures for the Eurozone, the US docket is particularly well-rounded. Business (NFIB) and economic sentiment (IBD) poll results are due alongside a key Fed official’s remarks around recession risks and the WASDE ‘softs’ commodity supply results for July. This can prove an important run of economic data.
Global Calendar of Major Macro Economic Event Risk for the Next 48 Hours

Calendar Created by John Kicklighter
While the data around recession fears should remain a top priority for those looking to keep track of dominant trends, the perception of monetary policy remains an area of near-term market activity. A particularly important event on tap Tuesday is the New York Fed’s consumer inflation expectation report for June. This a reflection of what this important group expects from prices going forward rather than just the realized readings we have seen through lagging data. It could be argued that is a more important insight than the official (but lagging) CPI release the following day on Wednesday. Meanwhile, the 20-year highs from the DXY Dollar Index seems more a result of favorable monetary policy views rather than the outright safe haven status of the Greenback. With a 75 bp rate hike fully priced in from the Fed through the July 27th meeting, the further chartered winds seems to depend on the probability of an outsized September increase of similar magnitude and beyond.
Chart of DXY Dollar Index with 1-Day ROC Overlaid with Fed Fund Forecast for 2022 and 1H 2023 (Daily)
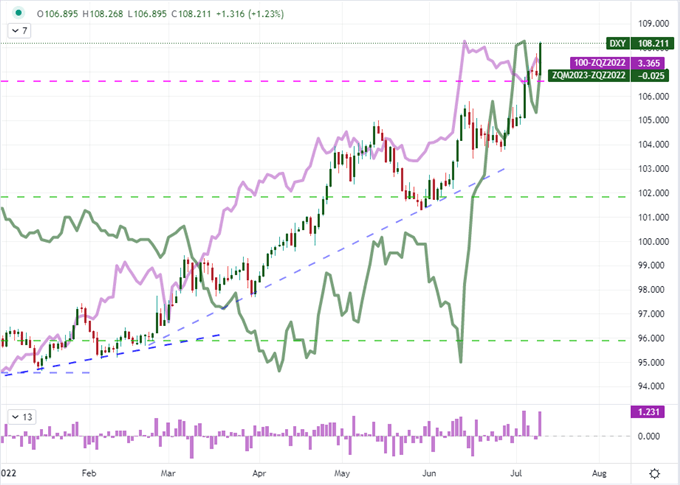
Chart Created on Tradingview Platform


