


S&P 500, Dollar, Recession, NFPs and USDCAD Talking Points:
- The Trade Perspective: S&P 500 Bearish Below 4,075; USDJPY Bearish Below 134.00; USDCAD Bearish Below 1.3100
- The S&P 500 has advanced for a fourth consecutive session, but the tempo leaves much to be desired – a hallmark of seasonal drift
- Top event risk Friday is June change in NFPs, but my top interest is not in EURUSD or USDJPY pushing multi-decade highs for the Greenback

S&P 500 Continues to Climb but On Seasonality Rather than Enthusiasm
The S&P 500 put in for its best daily charge in two weeks this past session, but the backdrop hasn’t changed. There remains a distinct lack of enthusiasm whether measuring through volume, open interest or fundamental foundation. And, though the June NFPs are on tap for Friday morning in the New York session; it is unlikely that the top event risk will provide a meaningful platform for a long-lasting bullish transition. When the outlook is defined by rapidly constricting financial conditions and growing certainty of a recession, there is an essential disconnect from building a lasting up trend. Nevertheless, the SPX has led other risk measures in a bounce that has stretched four consecutive sessions. That matches the longest stretch of gains for this ‘risk’ benchmark stretching back to November 8th – though the even with the 1.5 percent gain this past session, it has been the least productive four-day charge of that time frame.
Chart of S&P 500 with 50-Daily SMA and 4-Day ROC (Daily)
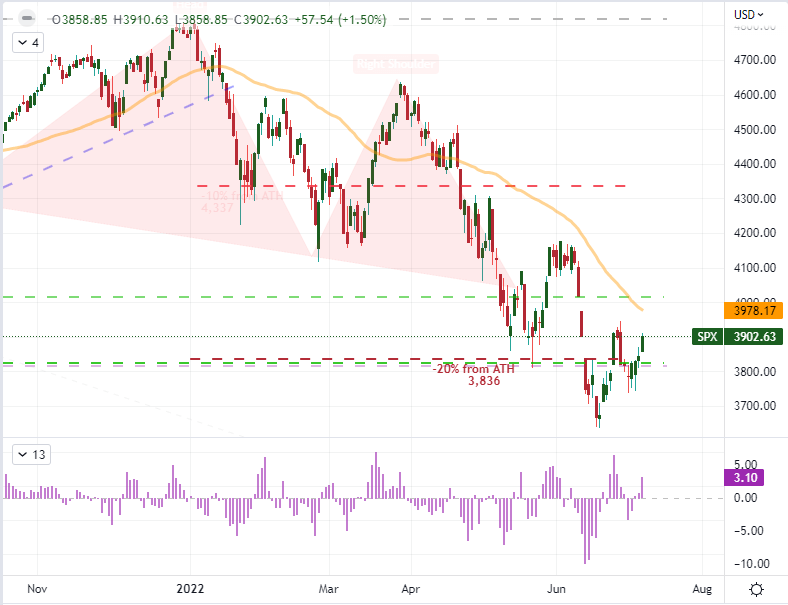
Chart Created on Tradingview Platform
While there are a number of explanations being applied to the S&P 500’s climb this week, I believe most that defy the bigger picture trend and fundamental landscape are ex post facto justification. It is more likely that the climb we have experienced this week is the result of seasonal expectations. Historically, this week registers the lowest volatility (via VIX) of the entire year. In turn, the curbed fear opens the market to opportunism which has in turn led the underlying S&P 500 to its second best week’s performance of the calendar year (after the first week of trade when capital is redeployed following year-end loss harvesting). At 2.0 percent thus far, this is hardly a roaring endorsement for a bull market recovery against such strong expectations.
Chart of Weekly S&P 500 Performance
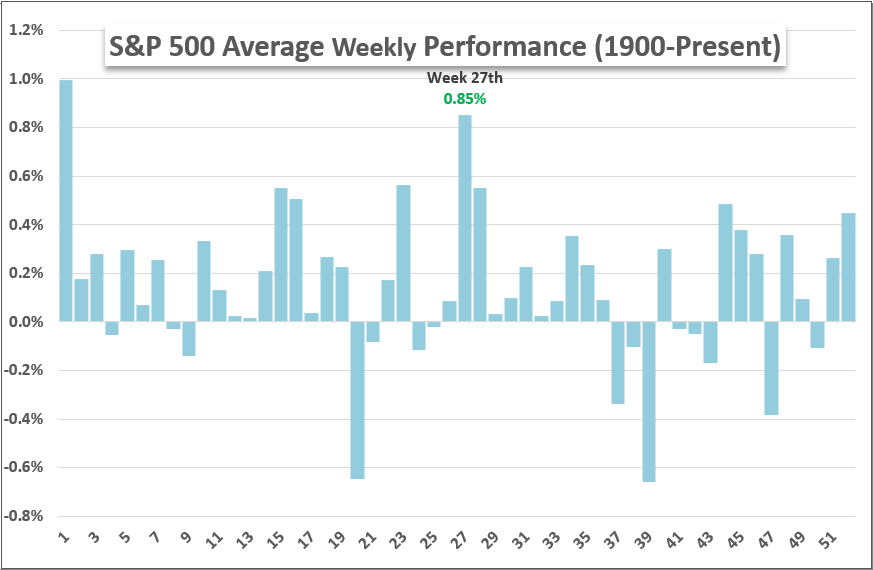
Chart Created by John Kicklighter
UK Prime Minister Resignation and Recession Fears Take Back Seat to Rate Forecasts
If you are looking for more persistent trend development, it is better to seek out a more reliable fundamental source than simply rely on seasonality to defy broader currents. There are plenty of fundamental sparks, but nothing that truly registers as favoring an inherent bullishness. This past session, news that UK Prime Minister Boris Johnson was stepping down seemed to bolster the Sterling and the FTSE 100 by lifting uncertainty in the London markets; but it is unlikely to provide a clear trend in those regional assets much less a definitive move on a global basis. More universal a theme is the outlook for global growth. There was a notable bounce in crude oil and modest jump in copper this past session; but that doesn’t override the erosion of these key commodities over the past few weeks, the result of a crumbling demand picture amid recession fears. The US 2-10 spread (10 year minus 2 year Treasury yield spread) is still inverted and there is no legitimate sentiment survey that says we have moved past the worst. In my own poll of traders asking what they thought the probability of a US recession by the end year’s end, 37 percent said it was a 75-100 percent chance while a collective 68 percent believe it a better-than-even scenario.
Poll Asking Traders What the Probability of a US Recession
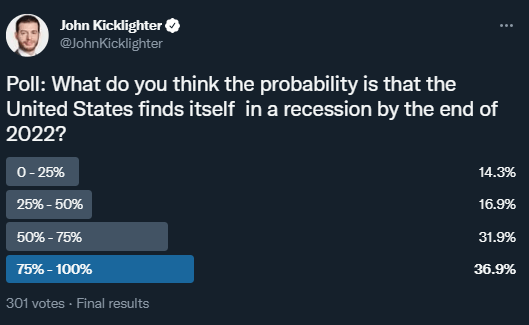
Poll from Twitter.com, @JohnKicklighter
As we sort through the top fundamental driver – and we should always have a view on what the dominant theme in the broader market is at any given time – I will continue to monitor the Greenback as a useful gauge. Whether we are evaluating relative interest rate forecasts, growth potential or risk appetite; this principal currency will provide a view. It is that evolving fundamental role that makes the Dollar’s gains that much more remarkable. Through Thursday’s close, the DXY trade-weighted Dollar Index was essentially unchanged which stationed the currency’s gains on the week at an impressive 2 percent gain – matching the strongest gains since the pandemic. That climb has pushed the market to its highest level in two decades, but there is an even more impressive technical milestone that has been surpassed with this unrelenting climb: a break through the 38.2 percent Fibonacci retracement of the Dollar’s historical range from 1985 to 2008. It is unlikely that many – even among technicians – will recognize this landmark, so follow through born of recognition is dubious. Yet, if we do have a sudden bout of risk aversion or the Fed rate outlook is charged, this measure is certainly positioned to take advantage.
Chart of DXY Dollar Index (Quarterly)
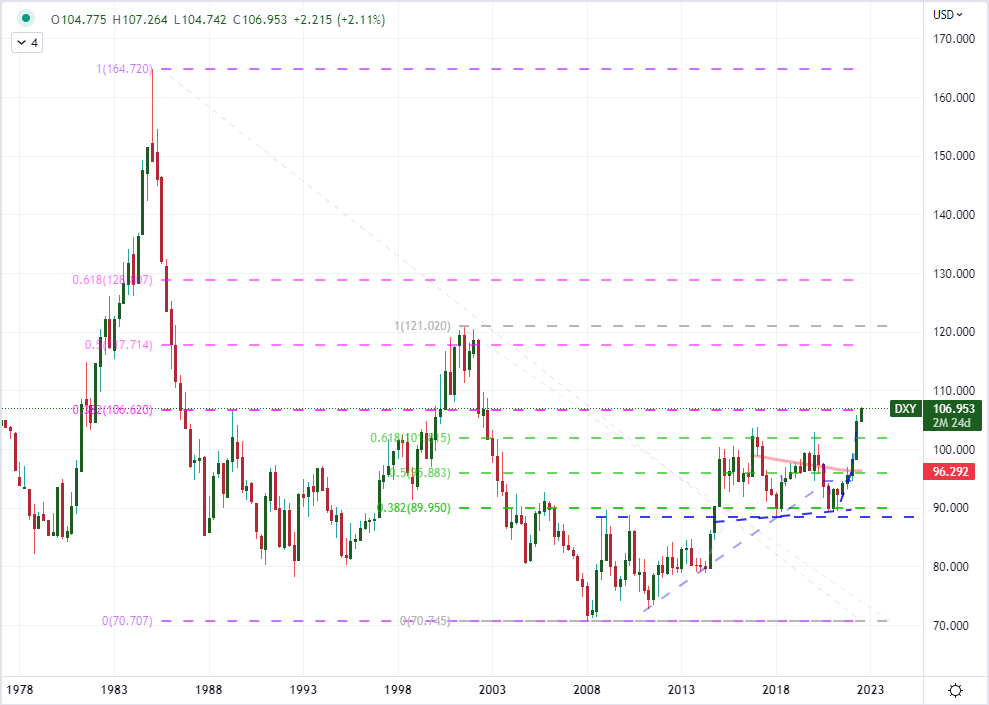
Chart Created on Tradingview Platform
Friday Top Event Risk and My Preferred Conduit for Volatility
Considering my ongoing focus is around risk trends and interest rate expectations, it stands to reason that the forthcoming monthly US payrolls (and broader labor report) release Friday morning in Washington holds serious potential. For context, the forecast for June nonfarm payrolls (aka NFPs) is for a net 268,000 jobs added in the US economy. We’ve had no ADP private payroll report to base forecasts, but the drop in the initial jobless claims and the ISM service sector labor component would suggest the risk is to the downside. How the market responds to the data depends more on how the Fed is seen reacting to the news. If the US economy added more jobs than expected, the boost to the economic outlook will be modest at best; but it will certainly justify the Fed’s commitment to push ahead with aggressive rate hikes – a benefit for the Dollar and serious threat to the S&P 500. Alternatively, if the report misses significantly, the economic erosion may do little to bolster hopes that the central bank will abandon its fight against inflation. There is a strong bias towards a bigger reaction to a ‘disappointment’.
Chart of US NFPs with Level of ‘Surprise’ between Expectations and Actuals (Monthly)
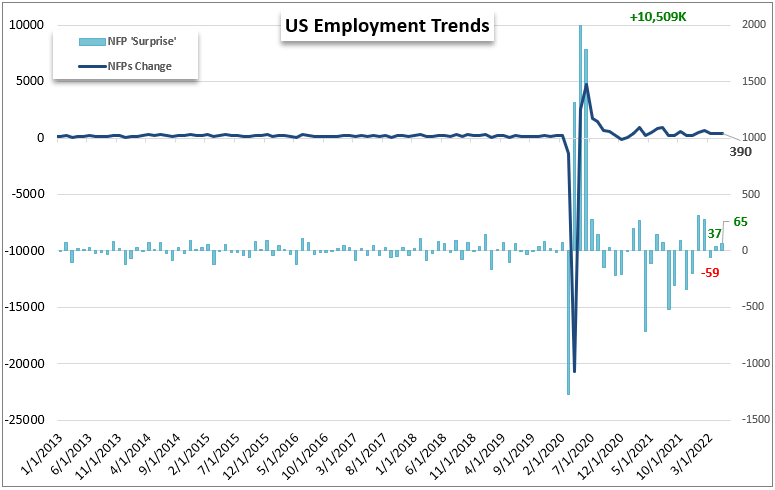
Chart Created by John Kicklighter with Data from the BLS
While I will absolutely be monitoring risk trends during the release of the US labor report, I believe that there is a more balanced opportunity for a response from the US Dollar. While EURUSD and USDJPY are pairs that are high up on my watch list in general for the third quarter – the former for convergence of monetary policy forecasts and the latter more a reflection on risk trends – my top interest for this data release will be USDCAD. There is no multi-decade bias in favor of the Greenback for this cross. Rather, it has been remarkably tethered to a broader range. What’s more, we are due Canadian employment data for June at the same release time as its US equivalent. That doesn’t necessarily align to supporting a clear trend, but it certainly bolsters the risk/potential of volatility. This is at the very least a pair to watch.
Chart of USDCAD (Daily)
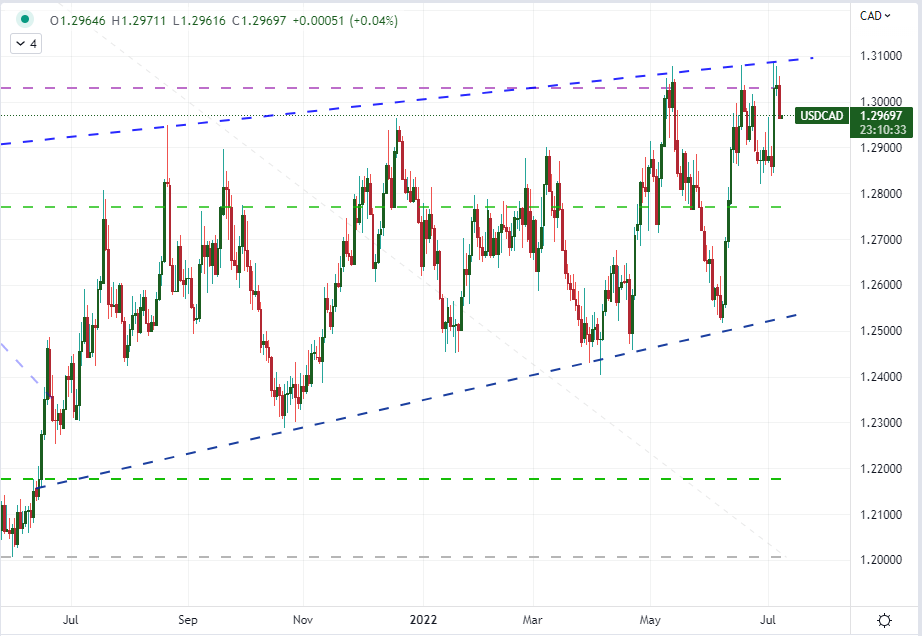
Chart Created on Tradingview Platform


