


S&P 500, FOMC, Recession, EURUSD and USDJPY Talking Points:
- The Trade Perspective: S&P 500 Bearish Below 4,075; USDJPY Bearish Below 132.00
- The combination of an unexpected rise in US CPI to four decade highs paired with record low consumer confidence pushed otherwise resilient sentiment over the edge
- Top event risk in the week ahead if the FOMC decision which will control anticipation and reaction, but mind the global rate and growth views

A Collapse that Bodes Poorly for What’s Ahead
Through the first half of this past week, the markets were doing their best to keep sentiment in check, perhaps hoping to coast on some early ‘summer doldrum’ mood as anticipation for the next major event risk (the FOMC decision) drew our attention further out. However, the fundamental pressure proved too much to bare for the complacent to keep control. What may have started as a ‘break of necessity’ turned into a move of conviction through the close of the week when it became clear that the probability of recessions across the globe was no longer an outlier scenario. For the benchmark S&P 500 index, the smallest trading range of 2022 through Wednesday turned into a full-tilt breakdown. There was considerable interest in the fact that the market put in for its worst week since January, but I was more impressed/worried that the Thursday/Friday collapse alone was the worst two-day drop (5.2 percent) in two years. We will start the new week with momentum still very fresh and a technical bear market designation less than 2 percent away.
Chart of S&P 500 with 20 and 100-Day SMAs, Daily Gaps in Blue and 2-Day ROC in Purple (Daily)
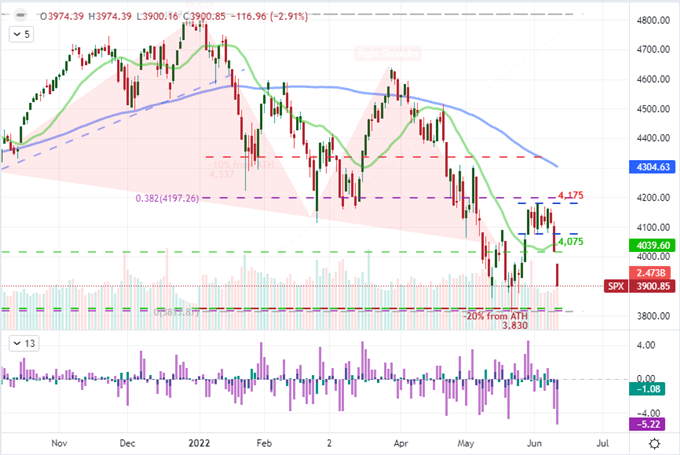
Chart Created on Tradingview Platform
A technical break on a singular asset – even one frequently considered indicative of general risk – is not sound enough a measure for me to believe that the tides have truly turned towards ‘risk aversion’. Yet, the pain suffered through the end of last week was far from isolated. Global equities were distinctly on the chopping block as were emerging market assets, junk bonds, Treasury derivatives and even carry trade. In other words, the fear was proving infectious; and that is what I consider to be one of the most productive drivers of markets overall: sentiment across the financial system. While there have certainly been times where various fundamental influences have overlapped to drive the market to a trend, the most persistent motivation for extended moves is collective fear or greed that spans the market. It looks like we may have be closer to that ‘vicious cycle’ than anything we have seen in many months.
Graph of Risk Trend Intensity
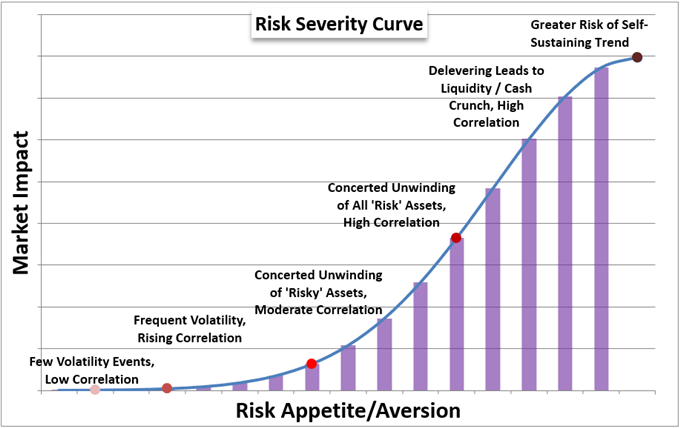
Chart Created by John Kicklighter
The Mood Has Shifted and There is a Minefield Ahead
If there were no major event risk through Friday’s session, the break that we registered this past Thursday could have very easily sputtered out. While the technical move from the S&P 500 was certainly provocative, that break alone would not likely have drawn longer-duration investors and die-hard bulls from their perch. The event risk that hit the subsequent session added serious depth to the surface level fears. US CPI – the market’s favorite inflation indicator – unexpectedly accelerated to a 41 year high 8.6 percent. That could have just been interpreted as an abstract booster of the Fed rate forecast curve if not for the University of Michigan consumer confidence survey that followed an hour-and-a-half later. The headline sentiment reading absolutely collapsed to the lowest reading from the series in its history, stretching back over 60 years. The connection between inflation, rate hikes and recession risks is increasingly evident. And, given that price pressures on staples like gas prices are pushing record highs on a daily basis exposing central banks’ impotence; it is very likely that a fundamental switch has been flipped to default to a bearish view ‘unless convinced otherwise’.
Chart of US CPI YoY, 5-Year Breakeven Inflation and Average Gas Prices in Dollar (Monthly)
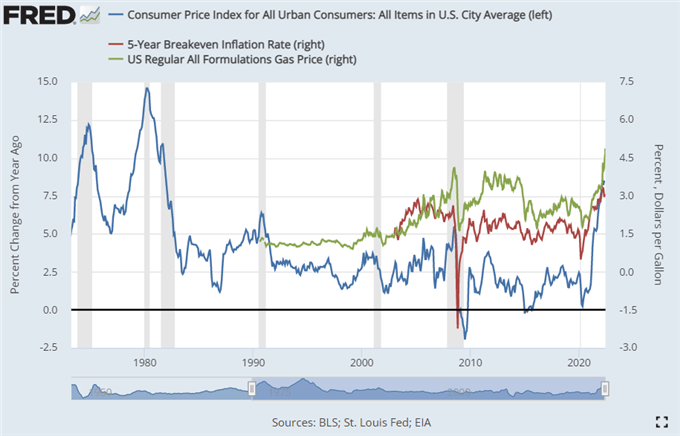
Chart Created on St. Louis Federal Reserve Economic Database
As we look out over the coming week, there is capacity for a relief rally from risk benchmarks. At the very start of the week, there is something of an economic quiet with few scheduled key data points on tap which could allow for the market to switch to a ‘wait and see’ mode in anticipation of the important FOMC rate decision on Wednesday. That said, the escalation of inflation risks have skewed the scenarios for the central bank to greater degrees of disappointment. There is little chance that the Fed can head off inflation without pulling the pin on a grenade for the market. Either we are facing a policy move founded on hope (inflation cooling on its own amid slow hikes), desperation (ineffective policy mix that attempts to balance growth and inflation) or represents the nuclear options (tackle inflation at the risk of near-term economic contraction). There is no good option here. Furthermore, there are further major central bank rate decision on tap which will only serve to highlight policymakers’ powerlessness – particular the BOJ and SNB which have stuck with extreme accommodation amid the global turn. If sentiment worsens on the rate front, it will only further amplify the impact that the growth-oriented data will have on markets, such as: US, China and UK retail sales; Eurozone investor sentiment; Australia employment; New Zealand GDP and much more.
Calendar of Major Economic Events
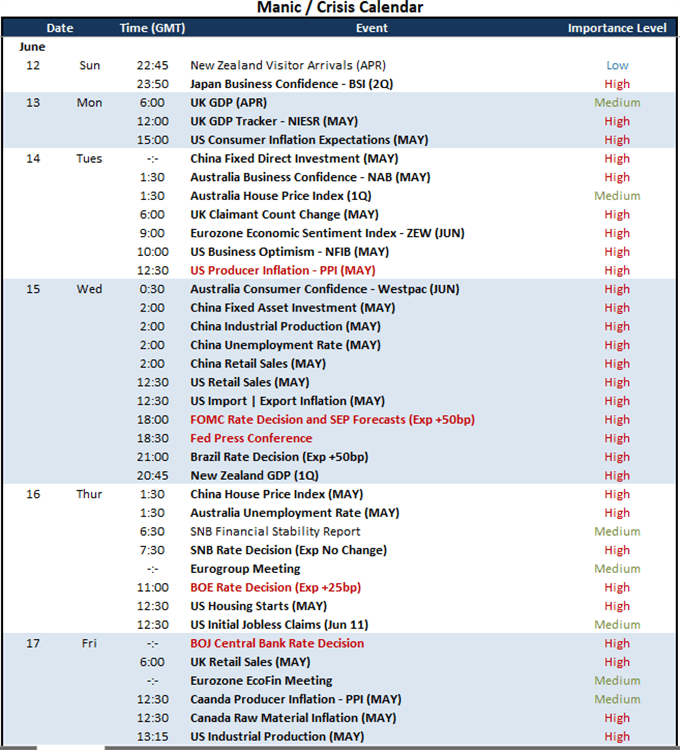
Calendar Created by John Kicklighter
Top Markets to Watch Next Week
There are a wide range of markets that I will be following throughout the coming week, but there are two benchmarks that will stand out above all others for their systemic implications. The first measures of great importance, with a distinct ‘risk’ orientation, will be the VIX volatility index. Whether you believe this to be a direct ‘fear gauge’ or a more complicated speculative instrument with ‘hedging’ properties, there is value to be drawn from its reflection of my favored one-look risk measure: the S&P 500. We have already been heading broadly lower through 2022, but we have yet to see a panicked state from underlying conditions that often signals a market has burned through its anxiety. That is what we seen through periods like March 2020, February 2018 and August 2015. Instead, our current situation sees a steady rise in volatility with relatively controlled peaks. That is the kind of backdrop that can cater to a drawn out bear trend. I will be watching the VIX to see if it comes close to the 50 mark as a baseline for extreme sentiment.
Chart of VIX with 20-Week SMA (Week)
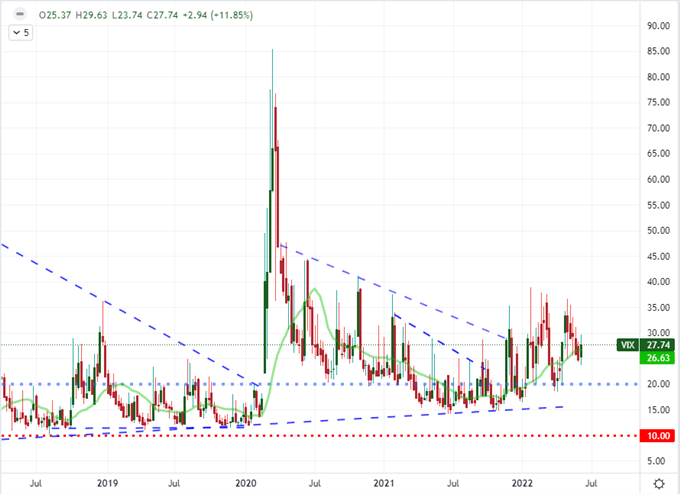
Chart Created on Tradingview Platform
A more complicated market that should be on all traders’ radars is USDJPY. I have spoke about this pair for some months because it represents a few major fundamental themes that can converge or conflict. Up until this past week, the steady view on risk trends allowed the expanding interest rate outlook carry the Yen crosses higher. Yet, the distinct drop in risk trends this past week represented a distinct threat to this major and its peers pushing multi-decade or multi-year highs. Rate forecasts for the Fed certainly rose this past week as seen in Fed Fund futures, but how much more is there to price in on this front? And how much premium is there for building up these wayward risk assets? If USDJPY reverses hard despite an aggressively hawkish Fed trajectory moving forward, it can carry profound implications for the market’s view on broader risk.

Chart of USDJPY with 20 and 100-Day SMAs and ‘Tails’ (Daily)
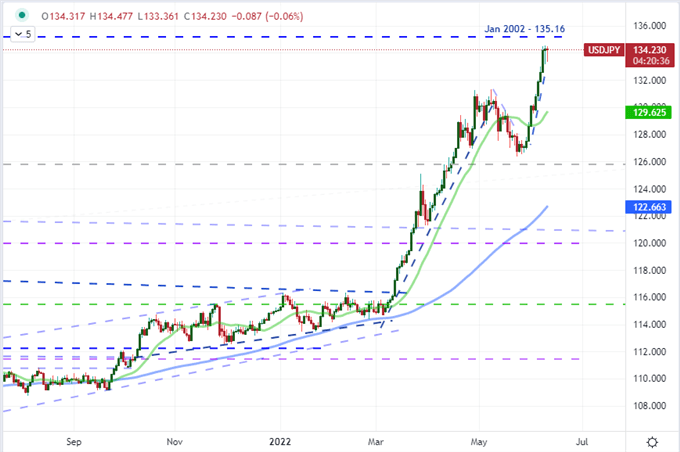
Chart Created on Tradingview Platform


