


S&P 500, USDJPY, AUDUSD, Growth Forecasts and Rate Hike Talking Points
- The Trade Perspective: S&P 500 Bearish Below 4,075; EURUSD Bullish Above 1.0800; USDJPY Bearish Below 132.00
- Breakout pressure is building to extreme levels with the S&P 500 carving out its smallest 7-day range since Jan 4th while the VVIX nearly matches a record slide
- The World Bank cut its growth forecasts sharply following yet another major central bank – the RBA – resorting to a hefty 50bp rate hike

How Extreme Can Breakout Pressure Build? Always Just a Little Further
Statistical extremes draw most traders’ attention. Whether or not we state it aloud, many market participants – myself included – register extremes with a belief that normalization must be imminent. Yet, ‘extremes’ can be relative to general market circumstances and our own experience with these unusual events. I’ve been tracking the combination of carry over volatility matched against persistently narrow range on the benchmark S&P 500 for some days. With the close of this past session, the index has seen its 7-day ATR (a volatility reading) edge only slightly higher with the day’s 1.0 percent advance – following a -0.6 percent gap lower on the open. That contrasts to the extension of a remarkably narrow 100 point range (approximately 2.4 percent of spot) for the same amount of time. That is narrowest trading corridor for this otherwise active and indicative measure since January 4th, when the markets were coming out of holiday conditions.
Chart of S&P 500 with 50-Day SMA, 7-Day ATR and 7-Day Historical Range (Daily)
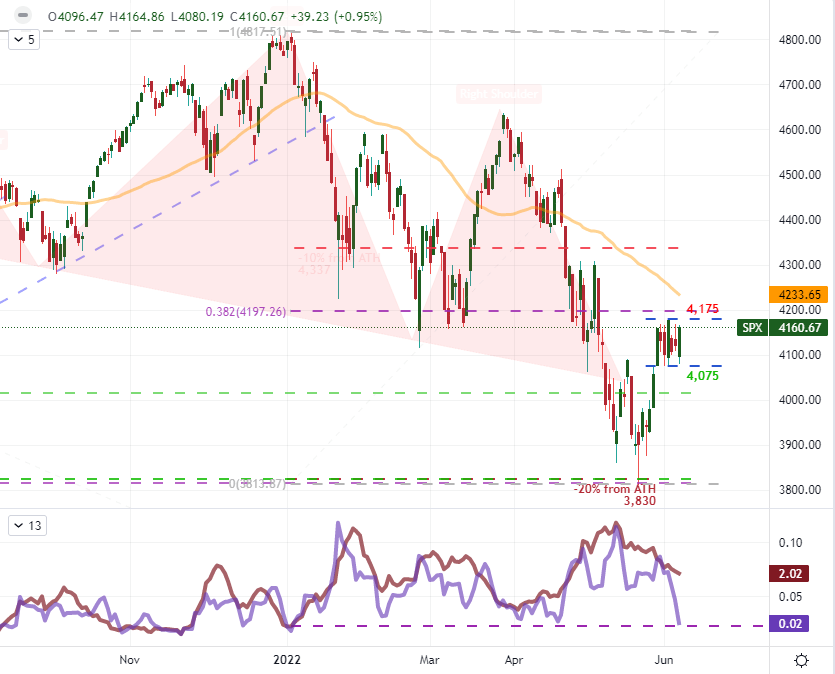
Chart Created on Tradingview Platform
We will inevitably clear the 4,175 to 4,075 range around the S&P 500, and the level of volatility we are carrying forward makes the proximity of that clearance much sooner than later. There is a very prominent and high-level US event risk to target one week out in the FOMC rate decision, but it is unlikely that we can keep this market anchored for that long without an extreme drop in volatility. Another measure that has become a highlight of how extreme our circumstances are is the VVIX – the ‘volatility of volatility’ index. A nine-consecutive day slide in this measure is the second longest in the indicators’ history and pushes the measure to 29 month lows. I see this as a complacency gauge, which suggests the market believes that a sudden change in volatility direction and tempo is highly improbable; but that directly contrasts the ongoing fundamental waves we are absorbing. From the SPX range, a break can resolve in either direction, but it is the historical correlation between the VIX and VVIX with the equity index – not to mention the state of the major economic themes – that suggests a bearish break would likely be significantly more productive in follow through.
Chart of VVIX ‘Volatility of Volatility’ Index, 100-Day SMA and Consecutive Candle Count (Daily)

Chart Created on Tradingview Platform
Bringing Forward the Recession Warnings
I was expecting a Wednesday release during the European session for the semi-annual World Bank economic forecasts, but they seem to have moved the timeline forward. No matter, the results of the projections were as troubling as was expected. Extending the downgrades in growth forecasts we have seen over the past few months from IMF forecasts to monthly PMIs to warnings from official groups like the White House; the group cut its outlook for economic activity across the world for 2022 by 1.2 percentage points to 2.9 percent. Some economies were in relatively worse positions than others (like the Eurozone’s -1.7 ppt cut to 2.5 percent growth compared to the US’s own -1.2 ppt reduction to 2.5 percent), but this downshift does not come as a major surprise. The warnings around the possibility of contractions for some major economies and a prominent caution of ‘stagflation’ make a troubled future increasingly tangible. That makes it hard to justify a drift higher in the risk-leaning measures.
Table of Economic Forecasts from the World Bank
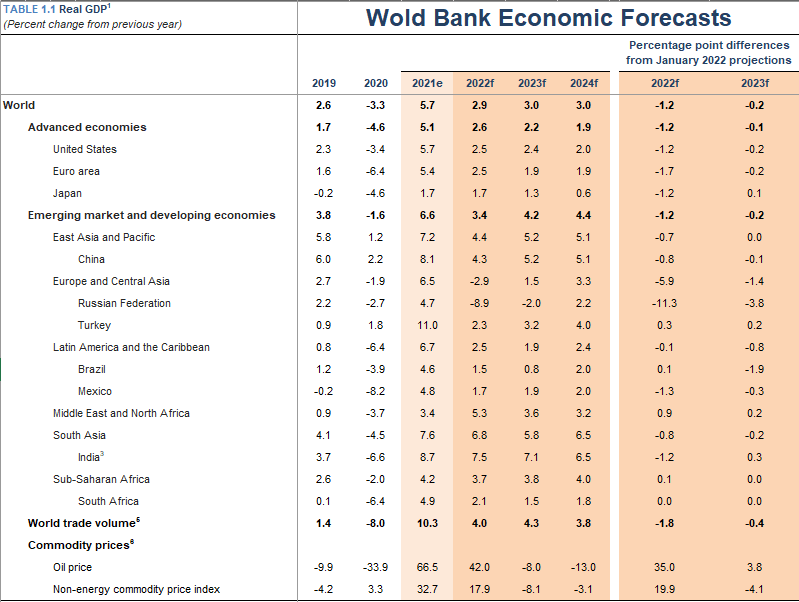
Forecasts and Table from the World Bank
When it comes to the impact of a fading growth forecast, the connection to price action can be rather ambiguous and frustratingly slow. Nevertheless, there are few other matters that compete for its influence over the long-term. For those assets that are more divergent from discounting traditional ‘risk’ implications and/or are distracted with other fundamental matters; the potential for fallout should sentiment reverse is far greater. I believe the Yen crosses are among the most exposed sentiment-oriented measures under these terms. And, among the various liquid pairings; the benchmark USDJPY draws the greatest attention thanks in large part to its liquidity. The major continued its advance to fresh highs not seen since January 2002 and increasing spots distance to the 200-day moving average comparable to disparity not seen in a decade. With a narrower field of vision, the 7-day rally of 4.2 percent matches the fastest pace of rally since the pandemic. As with the S&P 500, the USDJPY is stretched; but this comes with a directionality reach that is likely to be rebalanced. And, even if you don’t intend to trade this pair, you should still watching it for a gauge of the influence between risk trends and carry appetite.
Chart of USDJPY with 50 and 200-Day SMAs, 7-Day Rate of Change (Daily)

Chart Created on Tradingview Platform
Monetary Policy Is Starting to Seriously Eat into Growth Forecasts
The first of four significant central bank rate decisions (coming up are the RBI, ECB and CBR) managed to surprise myself and many other traders – though the price action wasn’t what one would expect from such an outcome. Instead of the consensus economist forecast for a 25bp hike, the Reserve Bank of Australia (RBA) joined a number of its global peers by announcing a 50bp hike that brought the benchmark up to 0.85 percent. In a vacuum, such a move would see the AUD surge against its counterparts as that was a poorly priced outcome that would confer greater yield to the currency. Instead, the price action we saw was volatile but ultimately lacking for trend. Why is that? To a certain extent, the market has priced in an aggressive hawkish outlook. Even though the pressure has increased earlier than expected, there is still plenty of premium behind the currency. What’s more, the RBA is far from the only major group pursuing an aggressive tightening regime.
Chart of AUDUSD with 200-Day SMA Overlaid with AU-US 2-Year Yield Differential (Daily)

Chart Created on Tradingview Platform
Taking a look at the major central banks’ benchmark rates, it is difficult to miss the pace of increase for many of the hawkish minded groups battling inflation. Amid the warnings over stagflation from the World Bank and ‘hope’ of a peak soon in price pressures from the US Treasury Secretary this past session, the battle against the economic pressure should not at all come as a surprise. On a relative basis, if the RBA, RBNZ, FOMC, BOE and BOC are all tightening in aggressive clips, there is not much yield advantage to be found between them. That would still make appealing counterparts perhaps of the Japanese Yen, Euro and Swiss Franc; but there is also a ‘risk’ implication here. A rapidly rising monetary policy regime cuts into growth potential as well as traditional capital markets. In other words, it stirs potential risk aversion. Beware the central banks’ tolerance for market pain.
Chart of Major Central Banks’ Benchmark Lending Rates (Monthly)

Chart Created by John Kicklighter


