


Nasdaq 100, Apple, Amazon, Facebook, Dollar and USDJPY Talking Points
- The Trade Perspective: S&P 500 Bearish Below 4,375; USDJPY Bearish Below 127
- Google and Microsoft earnings didn’t do the Nasdaq 100 any favors Wednesday, and now NDX is stationed at support heading into AAPL and AMZN earnings
- While US earnings represents a top candidate for driving risk trends; additional top event risk includes US GDP, Eurozone inflation and a BOJ decision

Unable to Step Back from the Ledge
We are heading into Thursday trade in the same precarious position we were facing at the start of the past trading session. There are a range of risk-oriented benchmarks that are hovering at or very near their respective levels of support, but none present a more prominent technical picture to me than the Nasdaq 100. The tech-heavy index has just this week returned to a technical ‘bear market’ (a more than 20 percent correction from all time highs) and has perched just on the precipice of a 13-month range floor. Earnestly break through 13,000 (315 on the QQQ ETF) and it is not hard to imagine that at least a serious crack will form for the hold out bulls’ otherwise unwavering sense oof conviction. A full-blown tumble may be difficult to keep burning with the anticipation for next week’s FOMC rate decision (expected to deliver a 50bp hike and a timetable for QT), but the likely scenarios are some variation of speculative weight rather than a source of relief. It is worth noting purely from the price action from the Nasdaq 100 that the effort to make up some breathing room with a bounce from 13,000 was completely unwound by the close of the New York session. That left us with a large intraday reversal that manifests on the charts as an ‘upper wick’. It would seem caution is prudent…even for the more risk tolerant among us.
Chart of QQQ Nasdaq 100 ETF with Volume; 20, 100 and 200-Day SMAs; ‘Wicks’ (Daily)
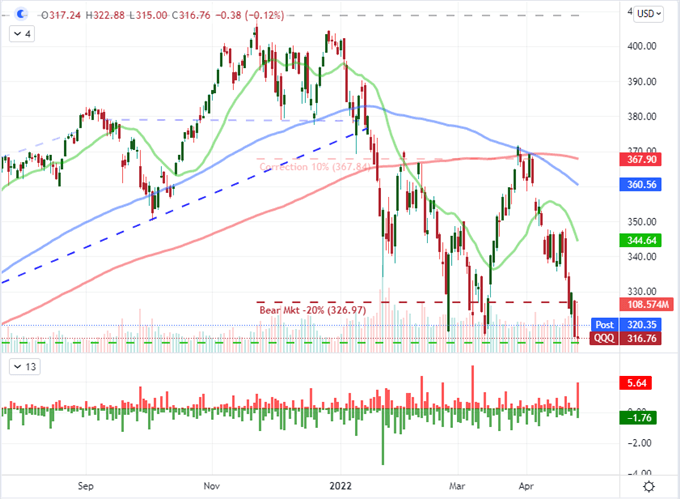
Chart Created on Tradingview Platform
While I consider the overwhelming influence of global monetary policy to be a much more comprehensive fundamental motivator for the financial system over the long-term, the markets tend to treat the driver as a cumulative influence that eventually builds enough weight to cause an avalanche. In the meantime, the milestones for the US earning season are meaningfully more regimented for timing and scale of impact. Last week’s Netflix miss caused a general shudder while yesterday’s Google miss and Microsoft beat would prevent us from finding any serious traction. After the close this past session, the only FANG+ member to report was Facebook, which beat expectations with a $2.72 EPS (vs $2.54 expected) and fell short on revenue of $27.9 billion (vs $28.2 billion). FB shares were up to 18.4 percent afterhours. As the 8th largest Nasdaq 100 component by market cap, that is significant, but we will see how much good will it earns the markets before Apple and Amazon cross the wires at 20:30 and 20:00 GMT respectively.
Chart of Facebook with Volume and After-Hours Performance (Daily)
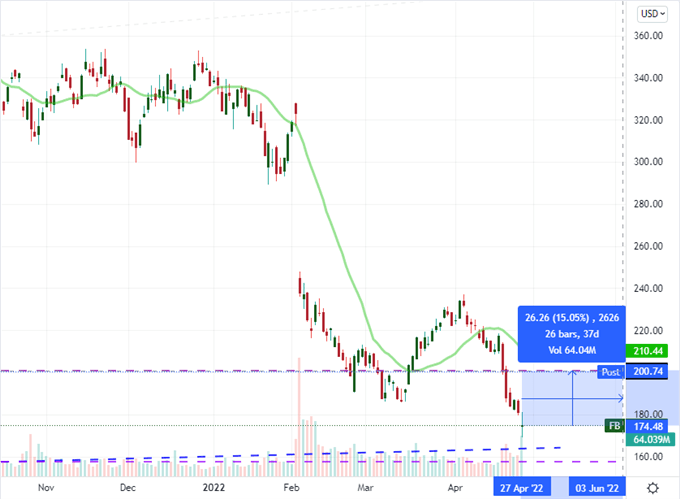
Chart Created on Tradingview Platform
The ‘Other’ Fundamental Themes to Monitor
The earnings docket offers convenience with top listings and discreet release times. However, that isn’t the only fundamental threat we should be tracking on the radar. Though it has fallen from the top talking points among global investors, the fallout from Russia’s invasion of Ukraine should not be ignored. Reports of artillery strikes across the border in Moldova are serious while Russia’s run of questionable data this past session (Jobless at 4.1 percent, industrial production growth of 3.0 percent and business confidence unchanged at -2) leave the assessment up to already dubious imaginations. It also precedes an expected 300bp Russian central bank rate hike Friday. That’s whiplash. In a more traditional vein, monetary policy will be a critical touch point between the Bank of Japan’s effort to commit to its dovish ways while also attempting to curb the Yen’s collapse, the ECB’s bearings will be influenced by Eurozone consumer inflation expectations (and German CPI) while US GDP will prove a more passive influence for FOMC speculation coasting through this media blackout.
Calendar of Major Economic Events
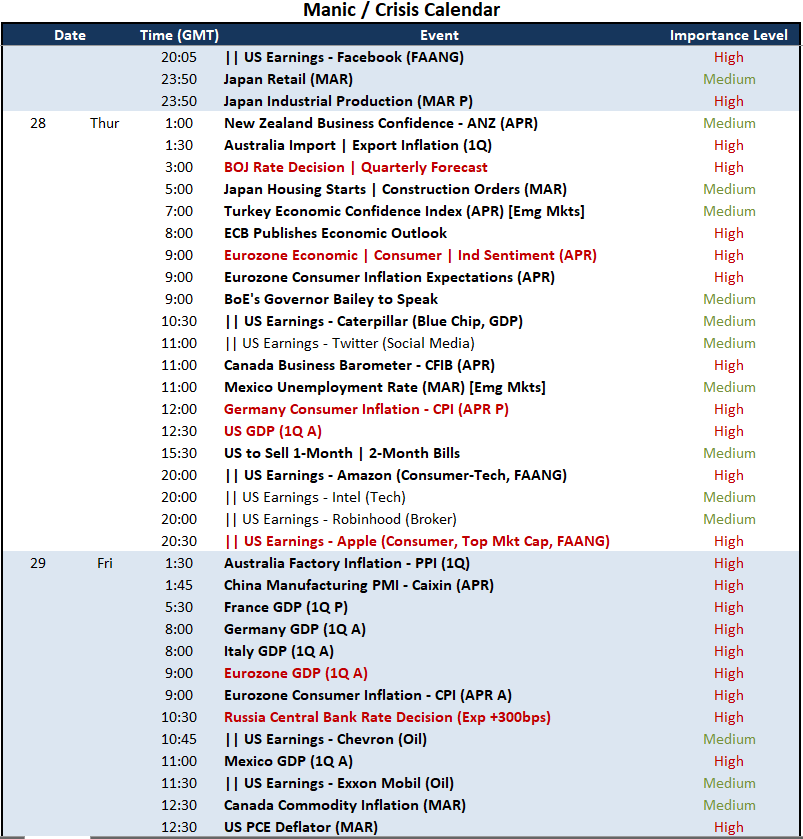
Calendar Created by John Kicklighter
For the US, there is the 1Q GDP release. This is a very important economic release, but its reflection of current – much less forward looking – conditions will be particularly restrained. We have already seen the April PMIs and the IMF’s updated 2022 and 2023 forecasts. Registering this lagging indicator as a critical update is unlikely. Nevertheless, the Greenback is at such a critical level that the markets may squeeze more influence from the report. A disappointing figure may help take some of the lift out the currency simply as justification to halt the climb to the threshold of two decade highs for the trade-weighted DXY Index. Meanwhile, the probability of a 50bp hike at next Wednesday’s meeting remains virtually backed in according to Fed fund futures, but the June 15 meeting has managed to raise the stakes even further. The probability of a 75bp hike at the subsequent meeting is now standing at 78 percent. Simply astounding and little to cut down on that speculation perhaps until Friday’s PCE deflator – the Fed’s favorite inflation indicator.
Chart of DXY Dollar Index with 10-Month SMA and 1-Month ROC (Monthly)
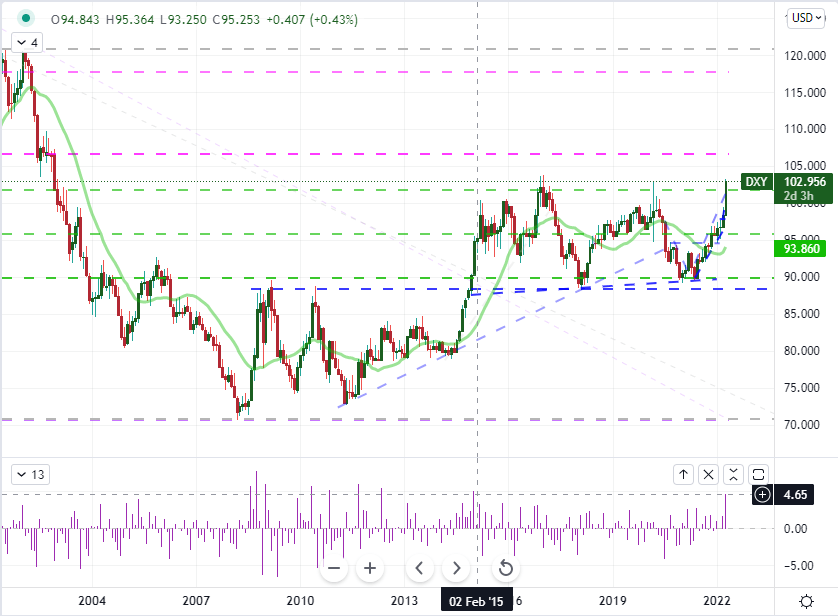
Chart Created on Tradingview Platform
The World’s Most Liquid Currency Pairs Continue to Bow to the Dollar
Given that the trade-weighted DXY is pushing to such extraordinary heights, it is perhaps no surprise that the currency’s principal crosses are exhibiting that same USD strength. USDJPY’s lift remains the most remarkable performance for my fundamental eye. We have competing themes playing out before our eyes. On the one hand, we have the Fed’s rate forecast managing to edge ever higher despite the unfavorable financial winds that have in the past urged market’s to expect the Fed put (shift to a dovish policy to sooth speculative fears) to kick back in. On the other, we have risk aversion that has torn down other Yen-based carry trades as the first stage of ‘risk off’ is to first unwind exposure – then transfer capital to havens. It seems the Fed rate forecast has overlapped the some extreme haven appetite for the Greenback enough to hold back the natural retreat from this Yen cross as well. I am eagerly monitoring to see how long this override can hold out.
Chart of USDJPY with 20 and 100-Day SMAs, 10-Day Correlations (Daily)

Chart Created on Tradingview Platform
As for the world’s most liquid currency cross, EURUSD, the math seems pretty straightforward. The ECB has vowed to stretch out its accommodative policy as far as it possibly can while the Fed has warned us to expect an accelerated hawkish turn starting with the official communique due next week. What’s more, the economic disparities between Europe and the US are exacerbating the very different ‘safe haven’ profiles between the two. This pair has dropped below 1.0600 and is now eyeing the lows last established back in December of 2016. Below that threshold below 1.0350, we don’t have anything to analyze on the charts since 2003. Keep track of the Eurozone docket with high profile German CPI, Eurozone consumer inflation expectations and Euro area sentiment surveys. That is fundamental fodder that hits in all the right (or ‘wrong’) spots.
Chart of EURUSD with 20 and 100-Day SMA with the Disparity between spot and the 20-Day SMA (Daily)
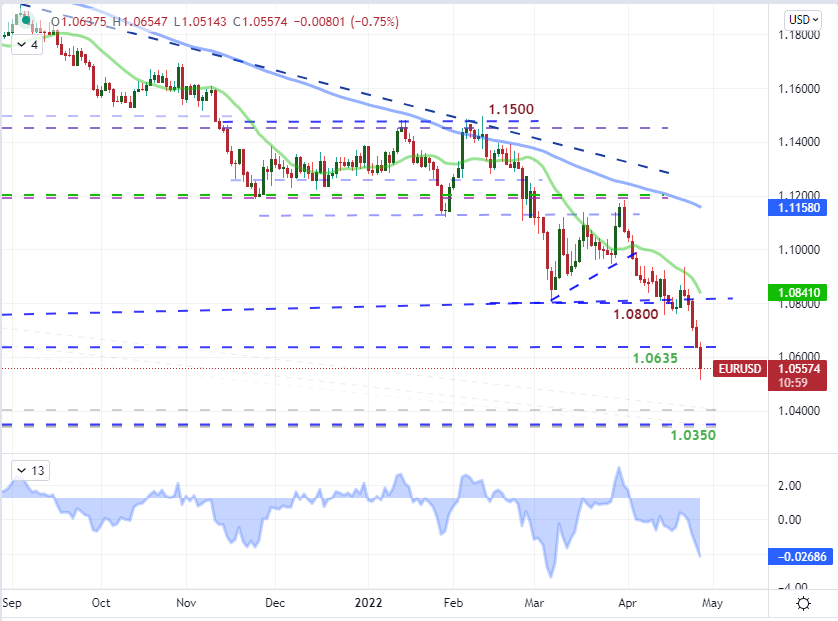
Chart Created by John Kicklighter with Data from IG


