


Dollar, Yield Curve, S&P 500 and Crude Oil Talking Points
- The Trade Perspective: USDJPY Bearish Below 121; AUDUSD Bullish Above 0.7450; Crude Oil Bullish Above $100
- The US 2-10 yield spread jumped back into positive territory this past session, but optimism around a cancelled ‘recession’ signal darkens when you look closer
- Russian sanctions have escalated without the heaviest measures while Fed rate forecasts continue to build speculative – and economic - pressure

Dollar at the Convergence of Risk Trends, Fed Forecasts and Recession Fears
There are numerous assets in the market that offer a unique insight on one or two key fundamental themes, but few benchmarks tap into all of the principal matters at once. The US Dollar is in a unique position at the crossroads of sentiment trends, monetary policy speculation, concerns of stalling economic expansion and foil to the Russian sanctions. With those elements all in play, it shouldn’t come as too much of a surprise that the DXY Index has extended a five-day rally to trade at its highest since May 2020. One of the most tangible means of traction this past session was the release of the FOMC minutes. On the back of Vice Chair Leal Brainard’s distinctly hawkish call for an expediated quantitative tightening – an extreme contrast to this top dove’s stance before her renomination – the report of details form the March 16th meeting noted, among other things, that multiple officials were pushing for 50 bp hikes at coming meetings. Below is the projected rate change through next month, but in probability terms, the chances of a half-a-percent move next month have risen to 79 percent with a subsequent 50 bp hike set at 85 percent. These are exceptionally hawkish forecasts, but it seems officials are catering to the market’s escalating views. A group so focused on messaging and forward guidance is likely allowing this speculation to build up on purpose – likely as they intend to act aggressively in May and don’t want a shock. The question for now is whether there is further, practical premium that can be built into this market?
Chart of DXY Dollar Index with 100-Day SMA Overlaid with Implied May Rate Hike (Monthly)
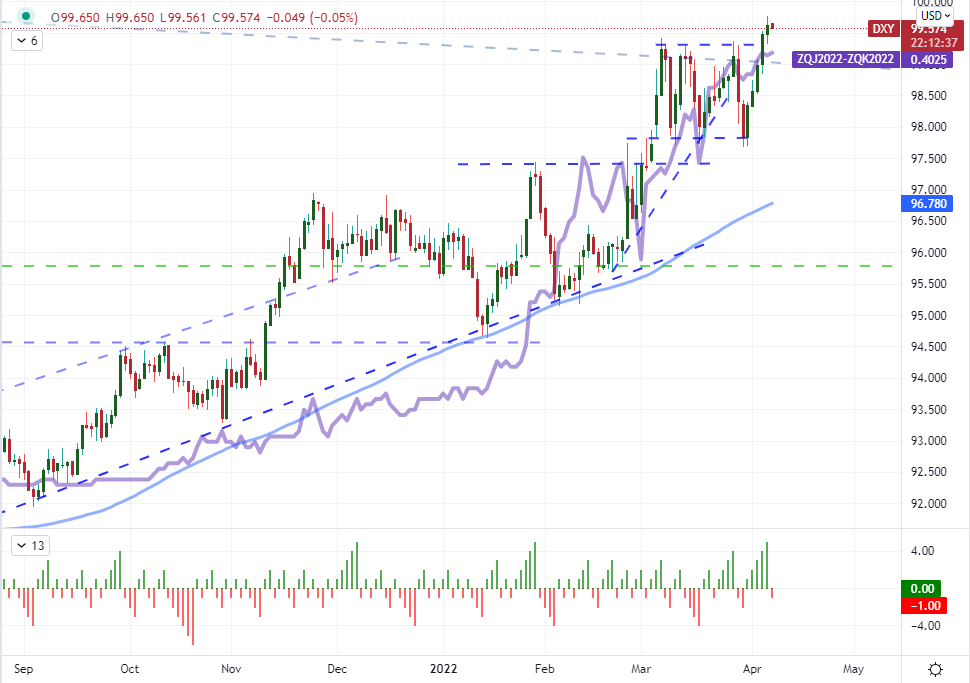
Chart Created on Tradingview Platform
Speaking of the US monetary policy forecasts, the implications of a rapidly rising benchmark rates has generated serious concerns for those that believe accommodation has played a critical role in fueling recovery. As the expectations of interest rates increasing have charged, the US 2-year yield (the same time frame for the Fed’s target ‘medium-term’) has charged over 200 basis points in approximately four months. That particular tenor’s rally helped drive the closely watched 2-10 curve (10 year minus 2 year Treasury yields) into an inversion. For many old hand investors, that is a ‘recession’ signal that cannot be ignored. Yet, I believe the assessment of economic contraction – which only Deutsche Bank has thus far projected for 2023 – depends on whether you believe financial market strength is principally dependent on central bank support. Interestingly, if you were to look at the same curve this past session, it could seem as all risks are off as it turned positive again. Yet, the key to this favorable flip seems the stronger drive of the 10-year yield as a response to the growing warnings of stimulus withdrawal. If monetary policy posses a serious risk to growth, it would be through the draining of liquidity in my eyes. Ultimately, I was not sold on a recession following the inversion, but the flip negative strikes me as even more problematic.
Chart of US 10-2 Yield Spread with 20-Day SMA, 2-Year Yield, 10-Year Yield (Daily)
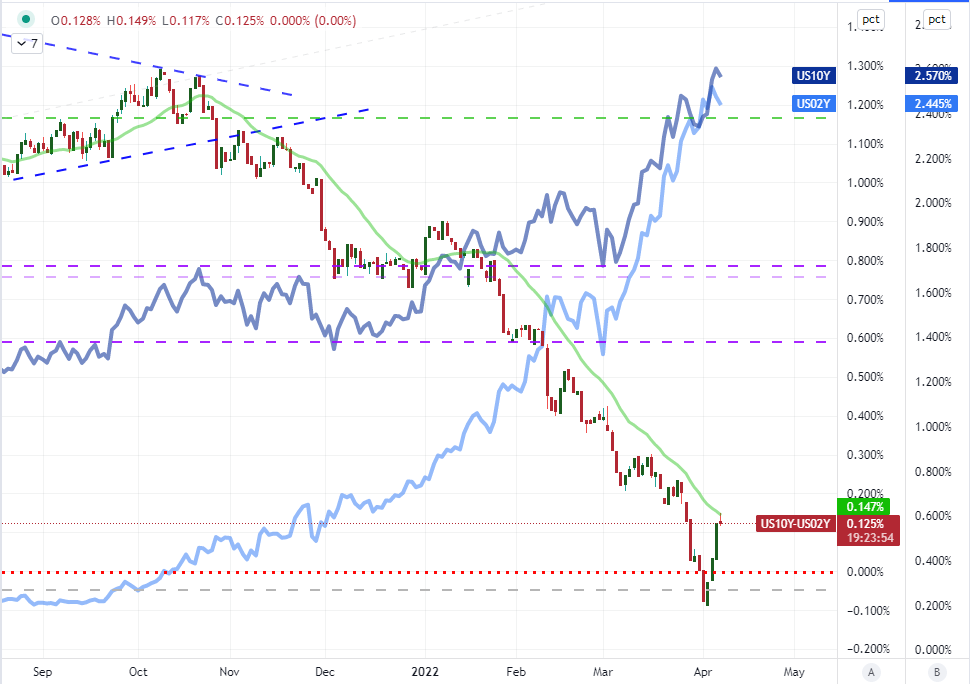
Chart Created on Tradingview Platform
Monetary Policy Is Not Just a US Sport
While much of the focus these past few days – thanks to the Dollar’s rally and yield curve activity – has been on the US, I consider the wider monetary policy theme to be far more important than just the ebb and flow of its symbolic leader. There was upstream Eurozone factor inflation data this past session to feed into the sensitive ECB rate forecast, but I think the groups actual monetary policy meeting minutes due later today will represent far greater interest. While there will be a lot of attention paid to the assessment of the timetable on their first hike, the simultaneous talk about QT for this exceptionally dovish group will probably prove a more significant driving forces. Meanwhile, the Australian Dollar’s charge from the RBA’s hawkish rhetoric on Tuesday seems to have been fully incorporated into the market with a notable loss of power. AUDUSD certainly was a challenge with the Greenback posting its own rally; but AUDNZD, AUDCAD and even EURAUD moved against the Australian currency this past session.
Chart of Central Bank Monetary Policy Stance with Rate Forecasts
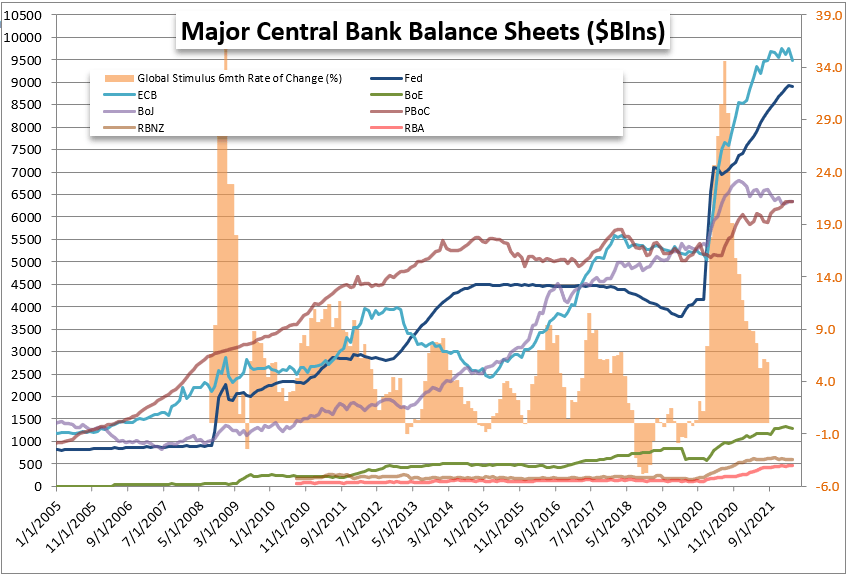
Chart Created by John Kicklighter
As far as capable themes, I believe monetary policy has the greatest trend capacity. The sanctions being applied to Russia and the financial blowback possible for the West may hold a more intense scenario for the market, but the practical probabilities of a normalization path are far greater with a systemic impact. For my measure on risk trends, I’m stick with the major US indices. That does not mean they are the best or most sensitive gauge of sentiment, but their bias helps define the signal. From the S&P 500 this past session, a sizable gap lower and modest follow through has added more anxiety as it cleared tight congestion. However, I still do not consider this a restoration of a 2022 bear trend until the closely-watched measure slips below the midpoint of this year’s range and the 20-day moving average around 4,465/4,450.
Chart of S&P 500 with 20 and 200-Day SMAs, Net Speculative Futures Positioning (Daily)
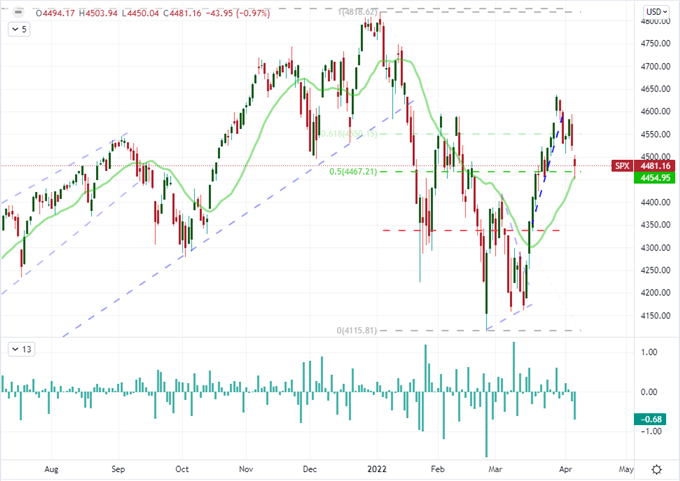
Chart Created on Tradingview Platform
The Other Fundamental Matters to Watch
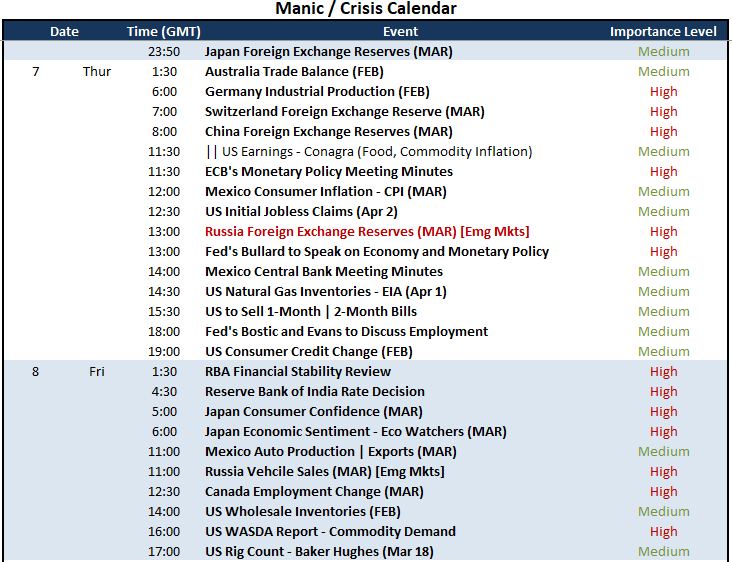
Not everything with market moving potential involves the Fed and US recession evaluation. Looking at the docket for the next 24 hours of the trading week, there is a theme of foreign exchange reserves on tap. I believe the Japanese, Chinese and Swiss reserve holdings for March are very important. All three countries are considered likely candidates to pursue intervention on behalf of their respective currencies. With that said, the Russian March reserves are the singular most important measure on the docket. This is not an update that I expect to directly stir a market like USDRUB or Moscow Exchange (those are being stabilized), rather it is a pressure gauge for a threat that can prove much more painful for the global system. If severed lines between Russia and the West forces significant losses on the latter’s investors, it can prove a touch off point for a global crisis – much like the implosion of a couple Bear Stearns hedge funds started the ball rolling of the GFC (Great Financial Crisis).
Chart of Major Macroeconomic Events
Calendar Created by John Kicklighter
Speaking of punitive pressure on Russia, the United States Senate is due to vote first on the removal of the former’s regular trade status and then weigh on whether to ban all energy imports from the aggressor country. That would be a significant escalation, but just like Wednesday’s actions to target additional Russian banks and President’s own daughters, the full economic weight isn’t felt unless more of the West swears off consumption of Russian oil, liquid natural gas and other energy products. I believe crude oil (even US-based WTI) prices are going to be key to tracking how the market’s perceive the fundamental winds to be blowing.
Chart of WTI Crude Oil Futures with 20 and 50-Day SMAs, Rate of Change (Daily)
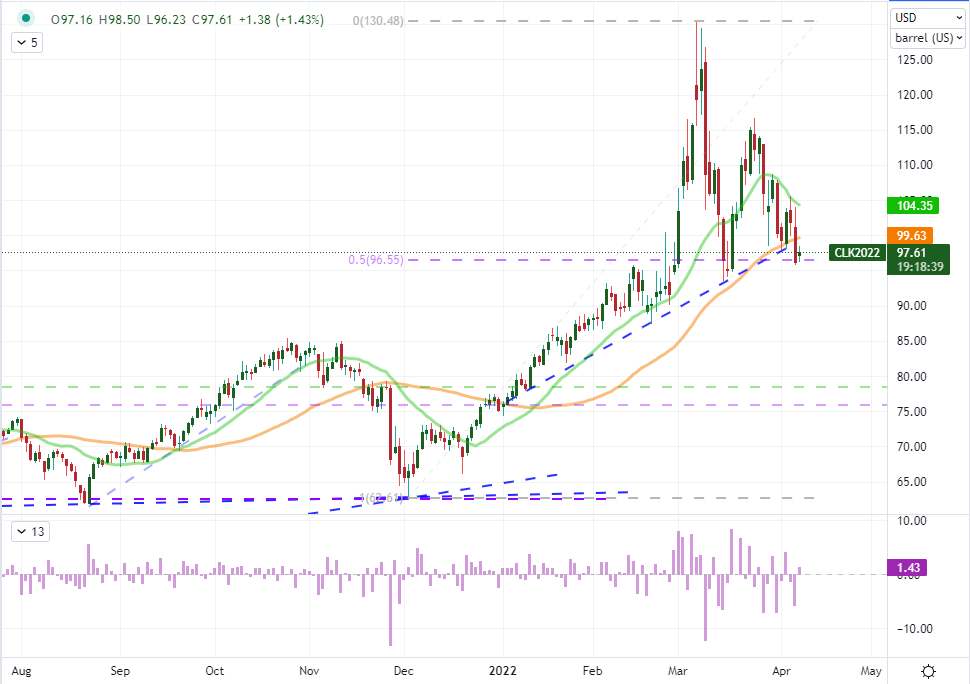
Chart Created on Tradingview Platform


