


YIELD CURVE INVERSION & S&P 500 OUTLOOK:
- The 2s10s stretch of the U.S. Treasury curve yield inverts and spooks investors
- Negative term spreads have preceded most recessions in recent years
- Despite heightened uncertainty about the outlook, the S&P 500 may still have room to recover in the coming months, though the ride to the upside is unlikely to be a smooth one
Trade Smarter - Sign up for the DailyFX Newsletter
Receive timely and compelling market commentary from the DailyFX team
Most read: The Bond Market as a Forecasting Tool for Stocks: Four Key Yield Curve Regimes
In typical economic environments, the U.S. Treasury curve will slope upward to the right, with bond yields rising along with longer maturities, reflecting investors' demand for greater compensation for the uncertainty associated with tying up their capital for lengthier periods of time (inflation, duration risks, etc). However, sometimes the opposite occurs, and short-dated securities offer higher rates than long-term debt. When this happens, we say the yield curve has inverted.
BOND MARKET FLASHES WARNING SIGNAL
Last week, the 2- to 10-year segment of the Treasury curve - known as 2s10s - inverted, with the difference between long- and short-term note yields (term spread) turning negative for the first time since 2019 as shown in the chart below. Historically, sustained inversions in the 2s10s curve have been very accurate recession harbingers in the post-World War II era, predicting all six recessions since the 1978, while only giving one false signal in the late 90s.
Related: USD Yield Curve - Capital Runs from Risk
US YIELD CURVE 2Y/10Y
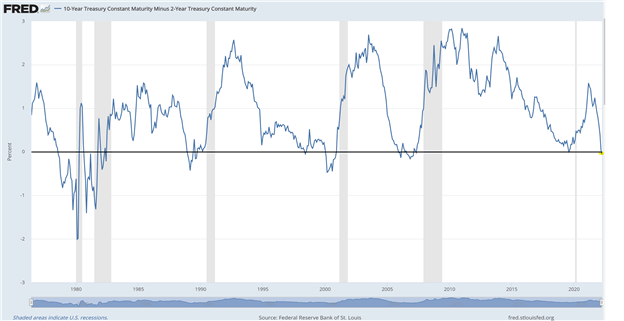
Source: Federal Reserve of St. Louis
HOW WE GOT HERE AND WHY IT MATTERS
The inversion in the 2s10s comes after the 2-year yield has risen frantically in recent months, soaring by more than 170 bps to 2.43% over the course of the year on hawkish repricing of monetary policy. With U.S. Headline CPI at 40-year highs (7.9% y/y in February) and risks skewed to the upside, the Fed has become more aggressive in its guidance, signaling that it is willing to frontload hikes and raise borrowing costs above the neutral level more quickly than initially envisioned to restore price stability, one part of its mandate. Yields on the 10-year note, which are more indicative of long-term economic growth and inflation expectations, have also trekked upward on the recent hawkish pivot, but the moves have been more measured, allowing credit spreads to compress and turn negative(the 10-year yield trades at 2.40% at the time of this writing).

IS IT TIME TO PANIC?
The 2s10s inversion is cause for concern, but not panic, at least for now. In the grand scheme of things, the credit market dislocation signals potential distress and a gradual decline in the economy. To see how bond dynamics are transmitted to the broader economy, let's focus on banks, whose business models are based on borrowing short to lend long. If term spreads compress and turn negative, financial institutions become less inclined to extend long-term loans, a situation that can tighten credit conditions and curtail economic growth. Eventually, this may tip the economy into a recession.
Related: Fed Policy Remains the Biggest Risk for Equity Markets
ARE WE HEADED FOR A RECESSION?
There is no arguing that the bond market is flashing red, but the 2s10s inversion may be less reliable in predicting a recession than in the past, mainly because the structure of the economy has changed over time. Let’s play devil’s advocate for a minute.
In recent years, and especially after the pandemic hit, the Fed's balance sheet has ballooned to nearly $9 trillion after steadily buying government debt to support the recovery and prevent long-lasting economic scarring. The Fed's huge footprint in the Treasury market has distorted asset values and depressed term premium, keeping long-term rates artificially low and out of sync with economic fundamentals. Some Wall Street estimates suggest that had the central bank not undertaken vigorous quantitative easing, the 10-year yield could be much higher, possibly closer to 3.7%. In this scenario, the 2s10s slice of curve would be far out of inversion territory.
Learn more: How the Fed Conducts Monetary Policy
FED BALANCE SHEET
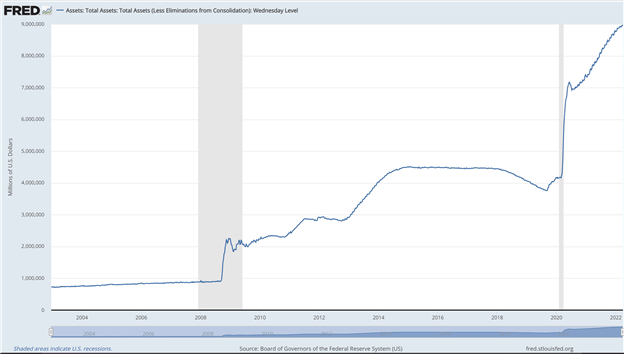
Source: Federal Reserve of St. Louis
The strength of some macroeconomic indicators also refutes the overly pessimistic narrative and provides some comfort. If gross domestic product (GDP) were imminently heading for a contraction, the labor market would be cooling rapidly. Obviously, this is not the case now; on the contrary, hiring has been robust as COVID-19 containment measures have been relaxed, with employers adding 562,000 workers on average over the past three months and the unemployment rate at 3.6%, the lowest level since the early 2020s. Strong job creation, running at twice the pace of the last expansion, will support consumption in the coming quarters, ensuring that the main engine of U.S. economic growth remains resilient.
Geopolitical tensions caused by the military conflict in Easter Europe also had a hand in the recent 2s10s inversion, albeit to a lesser extent. The invasion of Ukraine by Russia initially fueled strong haven demand for U.S. securities, underpinning prices of the benchmark 10-year bond and preventing its yield from rising too much, despite the Fed's intentions to begin normalizing its balance sheet.
Another factor to consider in assessing the likelihood of a downturn is that not all parts of the yield curve are signaling stress or have inverted. For example, the interest rate differential between the 10-year note and the 3-month note – known as the 3m10s curve -, which is more important for policymakers, is nowhere near inversion; in fact, it continues to steepen, with its spread sitting at +185 basis points at the time of this writing. This steepening is consistent with strong employment gains, robust consumer spending, and increased productivity-enhancing investment by U.S. businesses.
YIELD CURVE COMPARISON
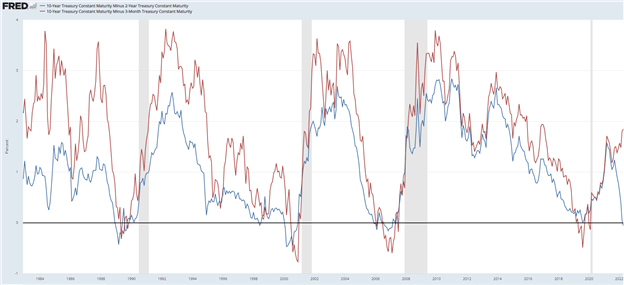
Source: Federal Reserve of St. Louis
Related: Energy Stocks Look Attractive on Soaring Oil, XOP and XLE Primed for More Gains
WHERE TO FROM HERE?
There are two key observations to make:
- Despite all the media noise and warnings, a recession seems unlikely at this point either in 2022 or 2023, although a slowdown is almost certain amid persistent supply chain bottlenecks and rising commodity prices. In any case, it is worth noting that based on hard data, the growth picture has managed to hold up well despite recent headwinds, including high inflation, low confidence levels and geopolitical turmoil.
- Even if the ominous signal emitted by the 2s10s curve turns out to be accurate, there is often a long lag time between inversion and recession, which can span from six to 24 months in the distance according to past observations.

STOCK MARKET AND S&P 500 OUTLOOK
Even if the worst forecasts materialize, it is important to emphasize that stocks do not tend to peak until six to 12 months into the 2s10s inversion and prior to the onset of the recession. This means that the equity market rally seen in March may still have legs, particularly as corporate earnings are expected to remain healthy by historical standards. Against this backdrop, the S&P 500 may continue to recover in the coming weeks and months, but the journey higher will not be smooth considering that volatility is likely to pick up in the near term. In any case, while further upside for the major Wall Street benchmarks (S&P 500, Nasdaq 100, Dow Jones) should not be ruled out, it may be a good time to begin adding some defensive playsas cyclical sectors fall out of favor, reflecting the stage of the business cycle.
EDUCATION TOOLS FOR TRADERS
- Are you just getting started? Download the beginners’ guide for FX traders
- Would you like to know more about your trading personality? Take the DailyFX quiz and find out
- IG's client positioning data provides valuable information on market sentiment. Get your free guide on how to use this powerful trading indicator here.
---Written by Diego Colman, Contributor


