


The first quarter was quite eventful for Wall Street, but the war in Eastern Europe was clearly a standout. Geopolitical tensions rattled financial markets, weighed on equities, and sparked a commodity price shock after the United States and its allies imposed heavy economic costs on Russia for invading Ukraine.
Oil prices, already on an upswing on supply-demand imbalances, soared to triple digits, reaching levels not seen since 2008. That owed to a rising risk premium and disruptions in energy trade flows after major international buyers began to ostracize Russian crude to avoid becoming entangled in sanctions indirectly.
Predictably, energy stocks gained in oil’s slipstream, building on the strong rally that began last year. Against this backdrop, the Energy Select Sector SPDR Fund (XLE) and SPDR S&P Oil & Gas Exploration & Production (XOP) ETFs surged more than 40% year-to-date. After this remarkable run, it's natural to wonder whether the energy sector's strong performance will continue in the months ahead. I am inclined to think it will, which is why I maintain a constructive view on the energy complex.
The bullish thesis rests on the assumption that oil prices will trade higher over the medium term, amid the current market deficit that is projected to last through the end of the year. This is as some Russian barrels are sidelined, U.S. producers stick to drilling restraint, and OPEC struggles to increase output due to capacity constraints. While the possible restoration of the 2015 Iran nuclear deal could bring relief to the tight supply situation, Tehran will not be able to increase exports immediately. In fact, it may take 6-8 months before most of its supplies come back online.
With WTI expected to persist above $100 per barrel for at least the next two quarters and a breakeven of $40 to $50 for shale drilling, the exploration and production (E&P) industry should rake in billions in profits, accelerate its deleveraging process, and improve shareholder returns through large buybacks and attractive dividends. Balance sheet metrics will improve significantly in a $100/barrel price environment, paving the way for the group to achieve a FCF yield of ~20% on average this year, marking some of the best offerings on Wall Street.
Looking ahead, investors may begin to prioritize valuations and focus on companies with healthy margins and steady earnings growth. This is in light of the high volatility environment and the extensive de-rating in some corners of the market on account of monetary tightening, inflation headwinds and cooling activity.
The US E&P sector is well positioned to take advantage of the shifting investment landscape and looks poised to continue to outperform in the months ahead.
To avoid company execution risk, I sometimes avoid single-stock investment. In this case, I prefer to express my bullish view on the energy sector through the XOP or XLE ETFs. Both funds look attractive, though XOP has greater gearing to higher oil prices (XLE is “higher quality” considering it only tracks companies in the S&P 500, but has some exposure to the equipment and services oil segment, which may be negatively impacted by higher input costs and wage inflation).
Focusing on technical analysis, XLE is approaching key resistance spanning from 78.55 to 80.25 at the time of writing. This hurdle has not been breached since 2015. A breakout above it is likely to spark strong buying interest, and price could be on its way to challenge the 84.00 area. On further strength, the focus shifts up to the November 2014 highs near the psychological 90.00 level.
Energy Select Sector SPDR Fund ETF (XLE) – Weekly Chart
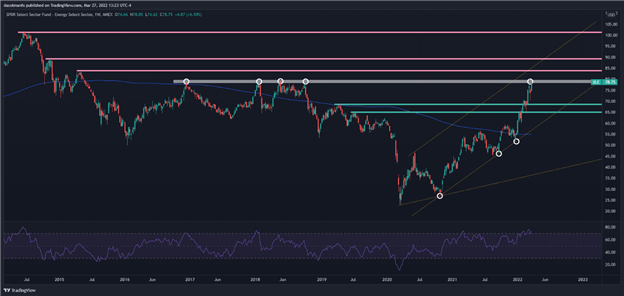
Chart created with TradingView, prepared by Diego Colman
Trade Smarter - Sign up for the DailyFX Newsletter
Receive timely and compelling market commentary from the DailyFX team


