


QQQ Nasdaq 100 ETF, Nikkei 225, Dollar, Gold, Earnings and USDTRY Talking Points
- The Trade Perspective: Broader risk aversion risk with QQQ below 200-Day SMA; Nikkei 225 bearish below 27,000; AUDCAD breakout candidate 0.9025/0.8975
- The late-in-the-day plunge from US equities Thursday poses a systemic threat for sentiment, but I would expect to see it track through Asia and Europe if gaining traction
- Scheduled event risk is light in Friday session – and severe for next week – but keep tabs on the Canadian Dollar crosses and its run of local data

Falling Deeper and Deeper Into a Retreat Dip Buyers May Fear to Go
Have the markets fully transitioned onto a self-sustaining bearish course? That is the question in my mind and I’m sure it is one many other traders are considering right about now. It is hard not to weigh this big picture question as it can dictate how markets trade through Friday, next week and even the rest of the quarter. Systemically, my assessment of the market’s health took a seriously bearish shift this past session late in to the New York trading session. While the benchmark US indices opened this past session strong – with gaps and a bid through the first half of the active day – it all fell apart spectacularly through the close. The QQQ Nasdaq 100 ETF extended its run of technical breakdowns from clearing range support last week at 380 to subsequently crashing channel support back to April 2020 to start this week, entering a technical correction (-10 percent from all-time highs) Wednesday and most recently dropping below the 200-day moving average this past session. It is hard to deny the progress, and there are increasingly prominent points of corroboration. The SPY S&P 500 ETF may still be above its 200-day moving average and further above its own ‘technical correction’, but it is nevertheless dropping in concert.

Chart of QQQ Nasdaq 100 ETF with 100 and 200-Day SMA and Volume (Daily)
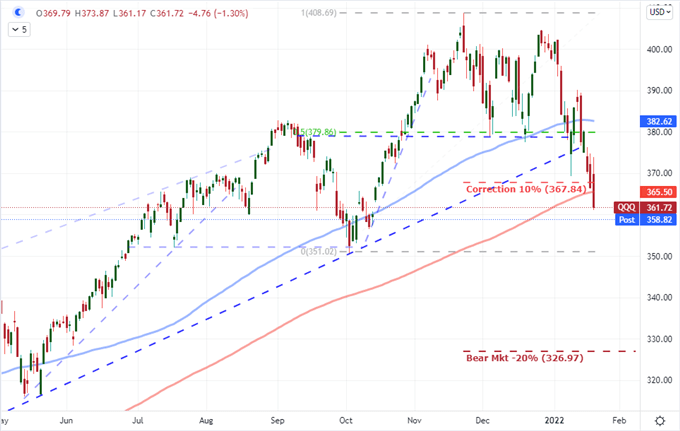
Chart Created on Tradingview Platform
In assessing my confidence in a systemic trend like market-wide risk aversion, I principally like to gauge breadth and intensity. We are seeing more of the latter, but the ‘risk off’ mentality is not gaining the same degree of traction across assets and the world – yet. That said, the erosion in sentiment from the assets previously considered to be pinnacles of speculative appetite is starting to build momentum and draw greater appreciation from market participants. The Nasdaq 100 to Dow ratio (growth to value) has been retreating from a record high that very briefly overtook the Dot-Com boom/bust peak back on December 1st. There is some added pressure to consider with Friday’s session given that Netflix shares collapsed -20 percent afterhours following the company’s expectations for 2.5 million new users in 1Q 2022 against market expectations of 6.93 million. Though NFLX has notably deviated in performance relative to its FAANG peers, it still carries the mantle of tech leader as it moderates from its post-pandemic peak.
Chart of Netflix to Nasdaq 100 Ratio Overlaid with Nasdaq 100 to Dow Ratio (Weekly)
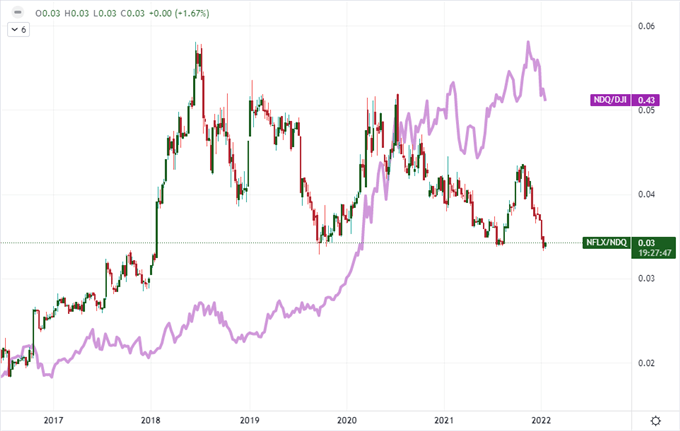
Chart Created on Tradingview Platform
Tracking Risk Trends in Technical and Fundamental Terms
In practical terms, I still consider market conditions most likely to work against a full-tilt breakdown through the close of this week. We are in the twilight hours of the trading week, and speculative shorts will be hesitant to hold their counter-trend positions through the weekend. Furthermore, we have the anticipation of heavy fundamental event risk in the week ahead – including the FOMC decision, IMF growth forecasts and US 4Q GDP release among other important data points. To commit to a trend in the face of this scale of data has proven unsustainable in the past. That said, a push lower is a trend far more likely to gain traction than the opposite. Fear is stronger than greed and particularly when liquidity is a problem. Therefore, those monitoring the health of the markets for Friday’s NY open should keep tabs on Asian and European indices to see the carry over. A benchmark like Japan’s Nikkei 225 is in a seriously vulnerable position, but the DAX40 and FTSE100 European benchmarks are still hovering at remarkably high levels.
Chart of Japan’s Nikkei 225 with 100-Week SMA and 1-Week Rate of Change (Weekly)
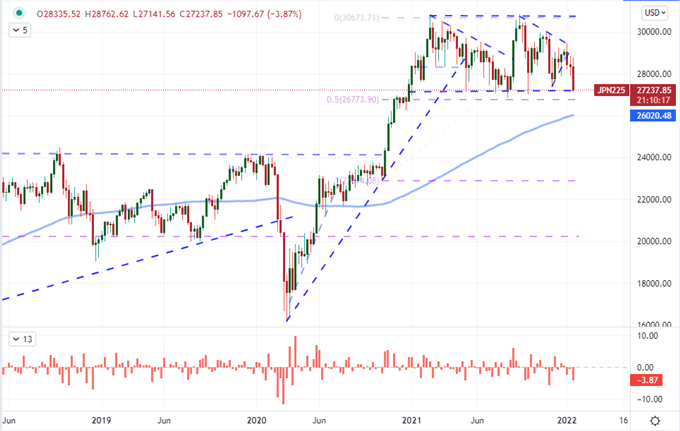
Chart Created on Tradingview Platform
On the fundamental side, I am increasingly less confident in the market’s ability to default to a ‘buy the dip’ mentality owing to the leading thematic concerns. While there are a number of issues that can hit at market confidence – growth forecasts, sliding earnings, fear of geopolitical flareups – monetary policy is moving in a definitively unfavorable direction. The attention surrounding the FOMC rate decision next week along with the time table and tempo of rate hikes the market has speculated on heavily is expected to receive a definitive update from the policy authority. The tightening regime has grown to frankly extreme levels that are difficult to believe given the pace last year and the unrelenting ‘transitory’ perspective around inflation. Nevertheless, fear does not need to be rational in order to spread.
Chart of Relative Monetary Policy Perception
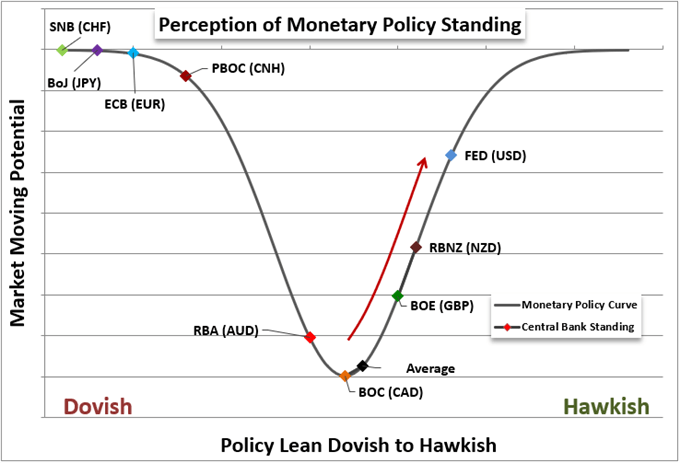
Graph Created by John Kicklighter
Markets to Watch…Beside the Obvious Ones
While I am most interested in the state of risk trends and the course setting on US and global monetary policy, there are plenty of assets to keep tabs on for more tactical opportunities. A counter-trend market that I continue to find interesting is gold. Despite the unmistakable risk aversion through the past session, this traditional safe haven very noticeably did not step into its role. For that matter, nor did the US Dollar and the traditional US 10-Year Treasury only exhibited a modest bid. This could be a sign that perhaps the market is not fully committed to seeing a reversal, but I also think there is a serious speculative bent to the precious metal. If risk trends bounce into Friday, it is more likely that gold sees its negative correlation to sentiment return for a move back into an established range. In the event that a way pulls the entire financial system out to sea, I prefer other have assets as plays over this commodity.

Chart of Gold Futures with 100 and 200-Day SMAs and Volume (Daily)
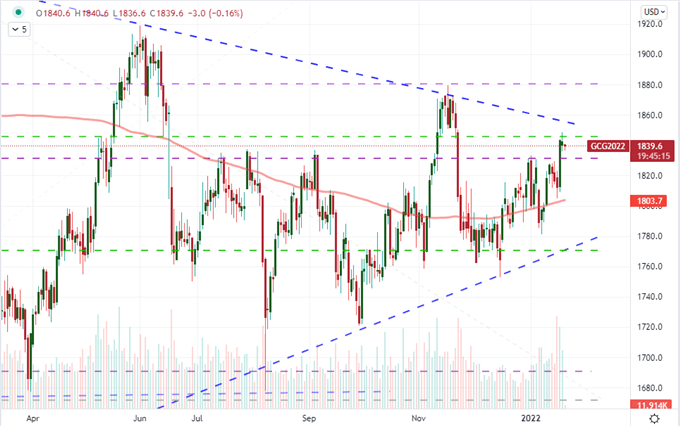
Chart Created on Tradingview Platform
Narrowing my view even further through the final trading day of the week, I would call out the fundamental listings of the Canadian Dollar. In an all-but empty economic docket, there is notable consumption, employment and housing data from Canada due for release. The Loonie has seen some meaningful gains lately with interest rates returning to their meaningfully hawkish bearing, but that is a stretched scenario that could also receive a more significant blow should the outlook flag under data. There are options for a bullish break for CAD, but the retreat seems more actionable should it show up. AUDCAD looks well positioned for this kind of situation with a range break back above 0.9050 more preferable to me than a slide below 0.8975.
Chart of AUDCAD with 200-Day SMA (Daily)
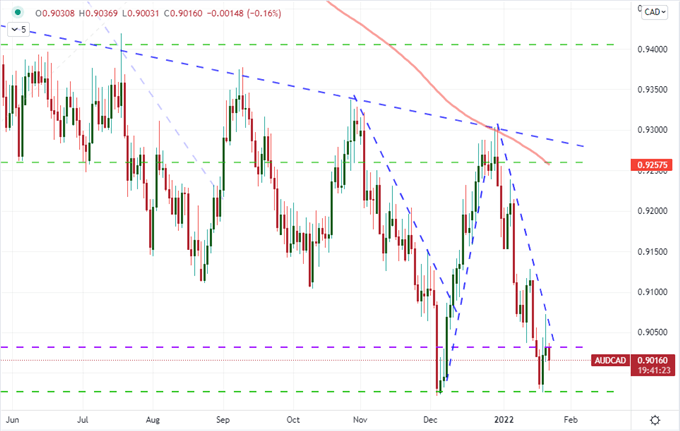
Chart Created on Tradingview Platform


