


S&P 500, Tesla, AMC, Federal Reserve, Yields, Dollar and USDJPY Talking Points
- The S&P 500 has matched its longest bullish run of consecutive daily advances since 2004 while the Nasdaq 100 finally slipped
- Tesla earned a disproportionate amount of attention Monday after CEO Elon Musk’s poll supported a large shares sales, but Google would also see its market cap overtake $2 trillion
- A warning from the Fed over the price level of risky assets reminds us of the lurking threats as global yields level out after last week’s slip despite the Fed taper

Risk Assets Continue to Stretch…and the Fed Has Noticed
We opened the new trading week with a slight shuffle in the speculative lead, but the undercurrent of risk appetite continues to carry sentiment forward. That said, the Fed is perhaps making a half-hearted attempt to rein in the excess between its tentative step into normalizing its extreme accommodation and a soft warning that it issued through its semi-annual financial stability report. Yet, the echoes of the FOMC’s QE retreat plan and the readily overlooked cautions didn’t seem to trip up the speculatively inclined as much as errant headlines on top tickers. Fear surrounding risk champion Tesla finally earned the Nasdaq 100 its first bearish day in 11 trading days. That said, the broader S&P 500 managed to edge its count up to an 8th consecutive daily advance to match its longest bullish stretch all the way back to November 2004. That is even more impressive a run given it comes at record highs and encompasses an overall period where the index has advanced 16 of the last 18 active trading sessions – which is the most bullish progress over a similar period in 50 years. Markets were already stretched by most fundamental metrics, but the technicals are starting to agree more broadly.
| Change in | Longs | Shorts | OI |
| Daily | 1% | -1% | 0% |
| Weekly | 15% | -13% | -1% |
Chart of S&P 500 with 20, 50 and 200-Day SMAs, Consecutive Candles (Daily)
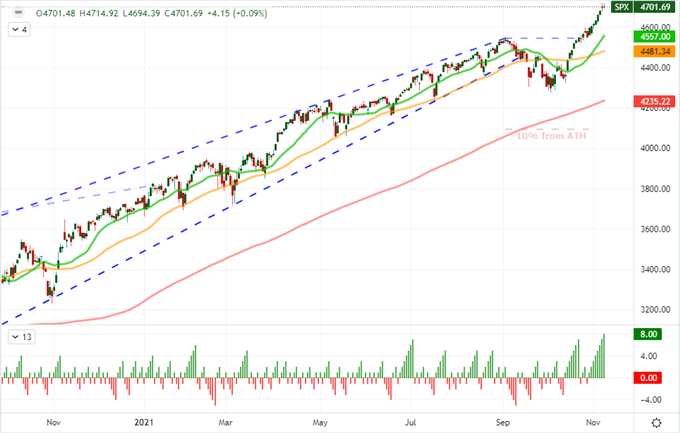
Chart Created on Tradingview Platform
Speaking of the fundamental side of the market, the docket this week is noticeably less dense of systemically-important, market movers that the previous two weeks. That absence can free market participants to dig into the implications of the developments that do occur, whether scheduled or not. Not on the economic docket was the attention fixed once again on EV maker Tesla after a poll conducted by founder and CEO Elon Musk resulted in a majority call (58%) by those voting that the major stakeholder should sell 10 percent of his shares in response to a proposed ‘billionaire’s tax’ on unrealized capital gains. As of the evening, it still wasn’t clear whether he would follow through or not; but he did state clearly he would “abide by the results of this poll”. This is a serious development given the concentrated ‘risk’ representation TSLA has represented the past few years in particular. Yet, it would also find a distinct contrast from the likes of Google. The tech giant was the third public company to surpass the $2 trillion market cap milestone when it only hurdled $1 trillion less than two years ago. These are dichotomous markets.
Chart of Tesla Overlaid with Google (Daily)
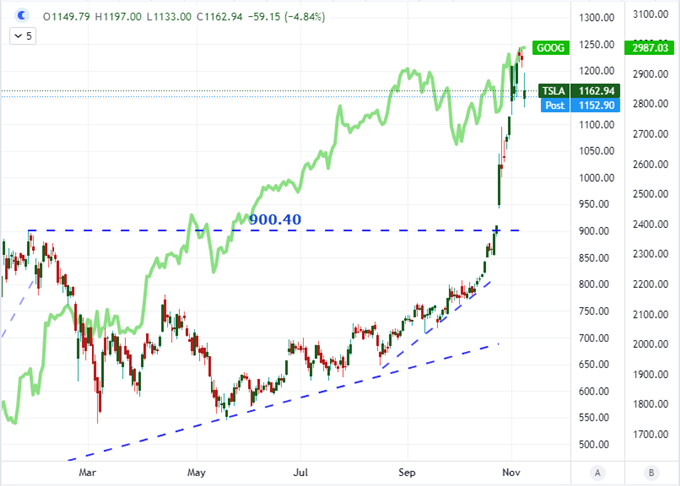
Chart Created on Tradingview Platform
Speaking of the contradiction, the backdrop has been well-crafted (perhaps unintentionally) to support speculative reach. The proliferation of stimulus after the cost of loans hit the floor has more than encouraged a sense that risks would be mitigated – it has essentially encouraged excessive risk taking by charging the typical ‘market’ benchmark (the S&P 500) to exceptional gains. In this most recent phase of speculative charge, the appetite for meme stocks and cryptocurrency has taken up the torch. Notably, Bitcoin was closing in on record highs again Monday while a run of once-Reddit board favorites (eg AMC) were reporting after hours. It is a slip back into bad habits, but the risks are starting to rouse the warnings of even the natural cheerleaders: the Federal Reserve. In its semi-annual financial stability report, the central bank warned that the rise in risky assets prices was a point of concern and that the new retail entrants were particularly exposed to losses given their leverage and use of assets like options to further amplify their exposure. Too bad this is exactly the group that will ignore warnings from a group like this.
Chart of AMC with Volume (Daily)
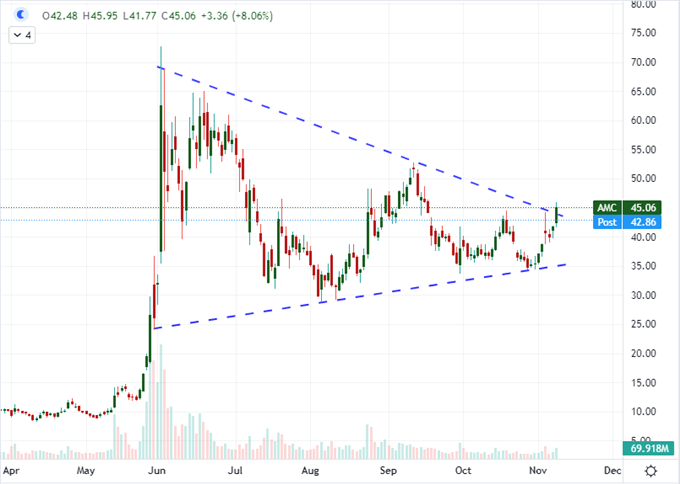
Chart Created on Tradingview Platform
The Fundamental Themes are Thinner, Allowing for More Traction
Checking the fundamental calendar, there isn’t much in the way of systemic threats. The Fed’s warnings and the market’s natural appetites will certainly amplify the second day of meme-stock (and IPO post-pandemic favorite) earnings releases. In the upcoming session, I am particularly interested in Palantir before the open; while the release of Coinbase, DoorDash and Nio speak to a different focus for investors. Central bank speak and sentiment surveys are similarly heavy in their listing over the coming 24 hours, but a surprise data point or misplaced statement may not easily stir the market to life unless the bias is already leaning in the bullish or bearish direction the commentary leans.
Calendar of Major Macro Event Risk for the Week
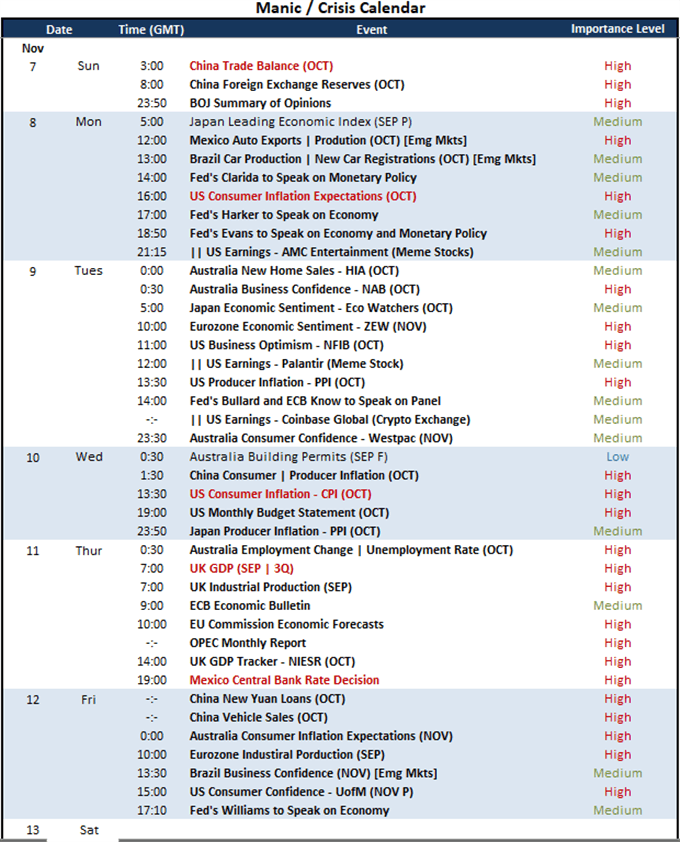
Calendar Created by John Kicklighter
For traditional fundamental themes, the tangible fundamental development through the opening day of the new trading week is the curb on the government bond yield retreat we had seen last week. Notably, after the Federal Reserve announced its taper plan, global yields accelerated a retreat ending a string of weekly gains that lasted nearly three months and had seriously accelerated through the close of October. It seems that interest rate speculation had accelerated faster than what the central banks had thought was practical even in an elevated inflation environment. Yet, how far would the two-year yields – more sensitive to interest rate speculation over the same period – really retreat if the policy authorities are indeed plotting their normalization? With plenty of inflation data ahead, and particularly from the Fed, this is a theme to watch closely.
Chart of US, UK, German, Australia, New Zealand and Japan Aggregate 2-Year Yield (Weekly)
Chart Created on Tradingview Platform
The Dollar’s Reticence and Incoming Inflation Data
Speaking of inflation, Monday’s session started a run of US price measures that has already caught most investors’ attention. The New York Fed’s one-year consumer inflation expectation figure jumped 0.4 percentage points to hit 5.7 percent – the highest reading since 2013. Expectations can often grow exaggerated – particularly at extremes – but we will see just how practical these expectations truly are over the coming 48 hours with official government inflation stats expected to cross the wires. The factory level PPI for October is due later today while the market’s favorite CPI crosses the wires on Wednesday. All this amid a dense run of Fed speeches that have already started to draw battlelines on hawkish-dovish views among the members. For the Dollar, I will note that net speculative futures positioning on USD-based contracts has shown a hawkish stretch extreme relative to more staid prix action over the past year.
Chart of DXY Dollar Index Overlaid with Net Speculative Futures Position (Weekly)
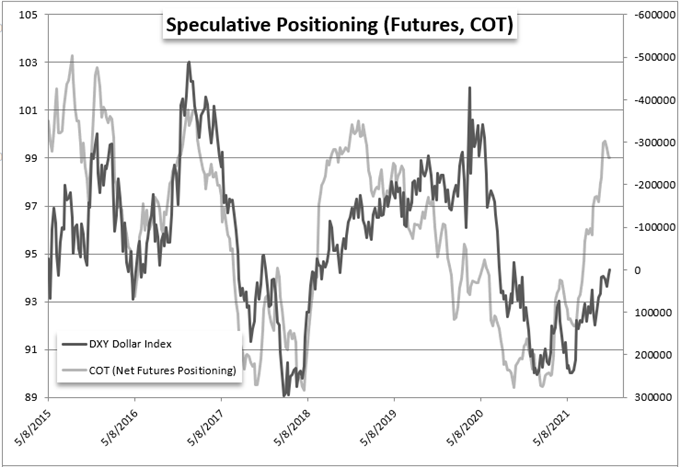
Chart Created by John Kicklighter with Data from Bloomberg
For Dollar-based majors, there are quite a few pairs that deserve a closer look. EURUSD is the most liquid and has clean technical boundaries on a higher time frame, but its depth works against a definitive move. Meanwhile, carry competitors like AUDUSD, USDCAD and NZDUSD are not going to offer a clear perspective unless the Dollar sorts its own standing. One of the my preferred outlets for the Greenback is USDJPY where its there is an abundance of meaningful technical levels – support and resistance – with a sensitivity to both risk trends as well as carry trade along with a particularly tight technical range. This looks a strong candidate for a break, but the circumstances have to line up for follow through.
| Change in | Longs | Shorts | OI |
| Daily | -2% | 2% | 0% |
| Weekly | 12% | -16% | -6% |
Chart of USDJPY with 200-Day SMA, 15-Day Range and 15-Day ATR (Daily)
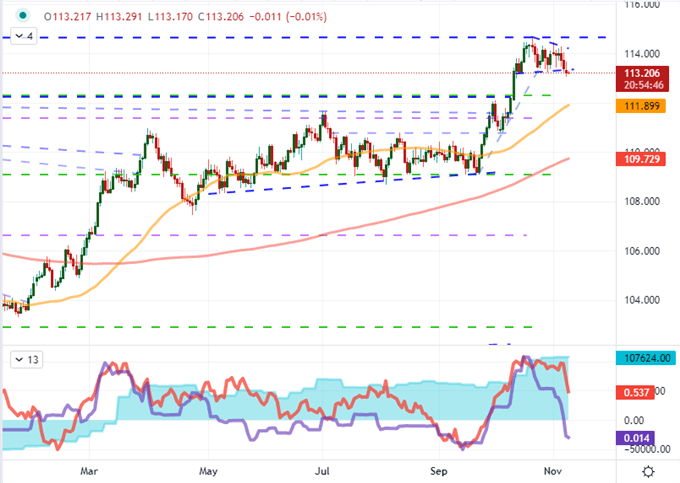
Chart Created on Tradingview Platform


