


Dow, NFP, EURUSD, USDCAD and USDJPY Talking Points
- Markets have been remarkably restrained this week – on point with the seasonal expectations but also an ominous lead in to Friday’s concentrated event risk
- While US NFPs are the top listing for the week, the ISM service sector activity report can similarly tap into Fed taper expectations
- As liquidity thins out before the US event risk Friday, be mindful of sudden and possibly extreme volatility in Dollar pairs and risk assets (eg Dow)

Where Seasonal Tides Meet a Rogue Fundamental Wave
Just how steadfast are the markets? We have witnessed extraordinarily reserved conditions for the financial system this week as structural quiet converges on the height of seasonal doldrums. Yet, that curb on participation can do more to amplify volatility than suppress it when passing through critical event risk – and that is exactly what we are facing into this final trading session of the week…and season. US nonfarm payrolls (NFPs) for August are due at 12:30 GMT before the US open, and the market’s fixation on the Fed’s intended time table for a taper has not abated alongside volume. Thin markets, extremely tight trading ranges and key event risk is a potent combination that active traders and passive investors alike should monitor. With the Dow as a foundational blue-chip risk measure extending its extremely controlled (now 8 day) range and volatility, it will be a good measure of sudden outburst.
Chart of Dow Jones Industrial Average with 50-Day SMA, 8-Day ATR and Range (Daily)
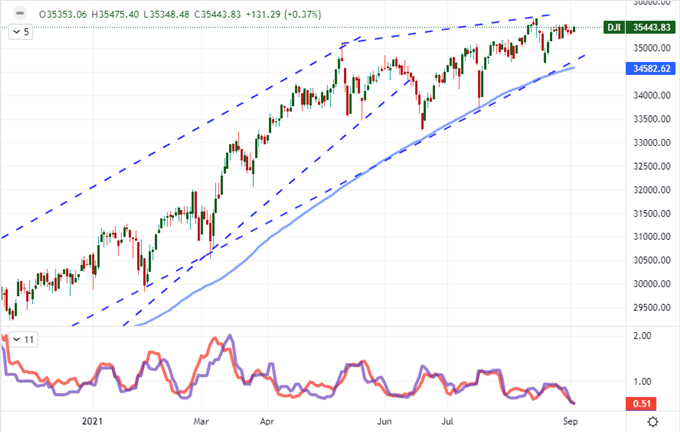
Chart Created on Tradingview Platform
While the event risk heading into the close of this week will be interpreted for its short-term potential for the final hours of trade left after the data hits until the weekend closes markets, it is important to remember that this fundamental heft for a general theme that will carry forward. The next major milestone for Fed timing is September 22nd, but with added liquidity starting next week, it can certainly turn the market over heartily with the mere return of speculative interests after the Labor Day holiday. Historical averages bear that out in SPX volume.
Chart of S&P 500’s Volume in the Weeks Before and After the Labor Day Holiday Per Year
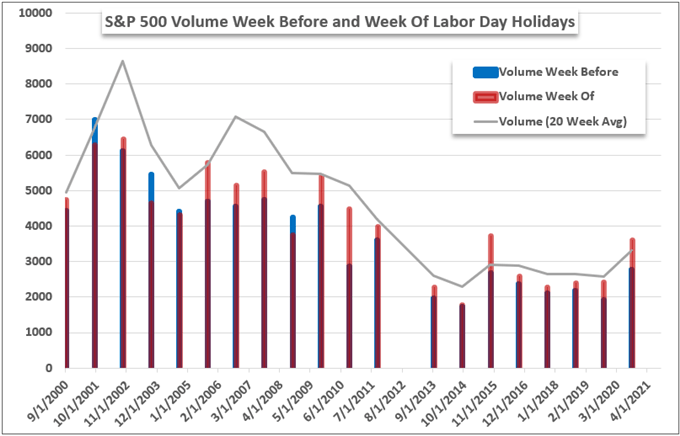
Chart Created by John Kicklighter with Data from Bloomberg
What to Expect When Your Expecting…NFPs
Historically, the monthly US labor report is one of the most market-moving releases in the pantheon of scheduled economic indicators. That said, its influence waxes and wanes depending on what high-level fundamental themes are spanning the entire financial system. As it happens, most major speculative roads trace back to the largesse of central banks, and there is no more prominent a benefactor to the speculator than the Federal Reserve. Officially, US inflation has met the targets for pulling back on accommodation, but uncertainty over the employment leg remains a sticking point. If there is a strong August showing, at least a few Fed members have said it could secure their conviction for an imminent taper vote. This past session, initial jobless claims and the Challenger job cuts dropped more than expected. That perhaps doesn’t carry as much a psychological effect on expectations for payrolls as the ADP and ISM manufacturing employment component did the day before, but it provides more speculative balance in the perceived possibilities.
Chart of Change in NFPs and ADP Private Payrolls with Difference Between Both (Monthly)
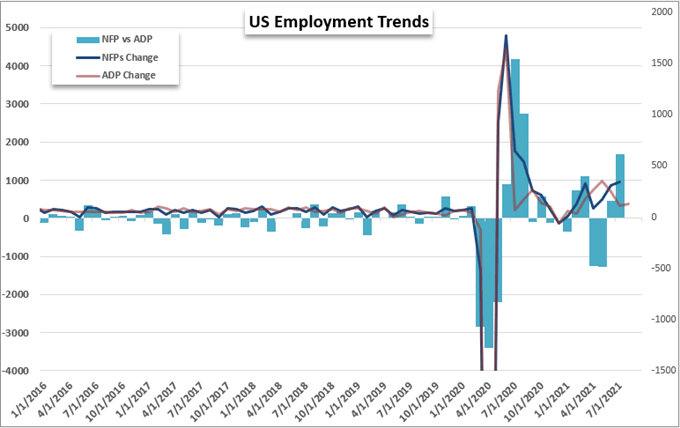
Chart Created by John Kicklighter with Data from BLS and ADP
While the market has gone a long way towards warming to the possibility of a Fed normalizing path, the past weeks of extended risk reach and the slide from the Greenback suggest the bias heading into the data is more dovish and thereby bullish. That doesn’t insinuate the outcome from the data, but it suggests the greater impact would come from a stronger reading that charges the Dollar and pulls indices down. Another consideration for the trading day ahead is the second major US data run that will hit at 14:00 GMT: the ISM service sector activity report. The US economy is predominantly services based in both employment and economic output. So, while the manufacturing equivalent on Wednesday nudged risk appetite and weighed the taper debate, the forthcoming activity report holds far more fundamental potential.
Chart of S&P 500 Overlaid with ISM’s Manufacturing and Service Sector Activity Readings (Monthly)
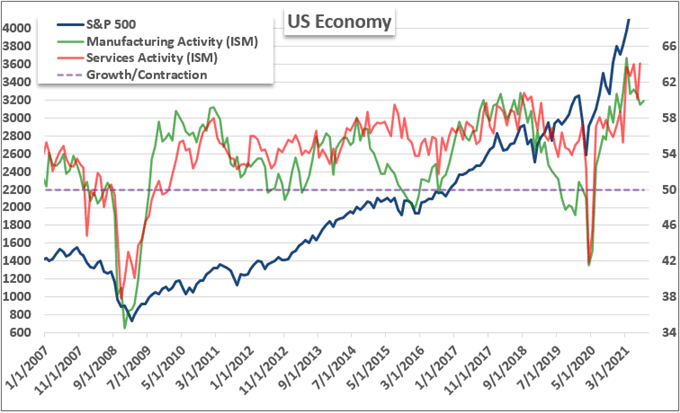
Chart Created by John Kicklighter with Data from ISM
The Markets That Will Register the NFPs Most Acutely
With the scenarios for the event risk ahead considered, it is important to then assess the vehicles through which you would particularly express a view on the outcomes. While the US indices as a juiced risk benchmark are very mature on a long-term basis, I don’t believe that stretch is culminating in a late, Friday reconciliation. There is certainly volatility risk, but the already limited follow through will be exceptionally truncated. The Dollar on the other hand has been under more distinctive pressure more recently. EURUSD is a proven productive after its break at the end of last week. The pair looks overbought on a technical basis and general conditions are tuned to balancing the market. To give a sense of the window of volatility we likely have to work with, the first vertical dotted line is the release time of the NFPs while the second is the close of the New York session. That is not a lot of time to generate serious progress.
Chart of EURUSD with 50-Day SMA and Disparity Index 50-Day (2 Hour)
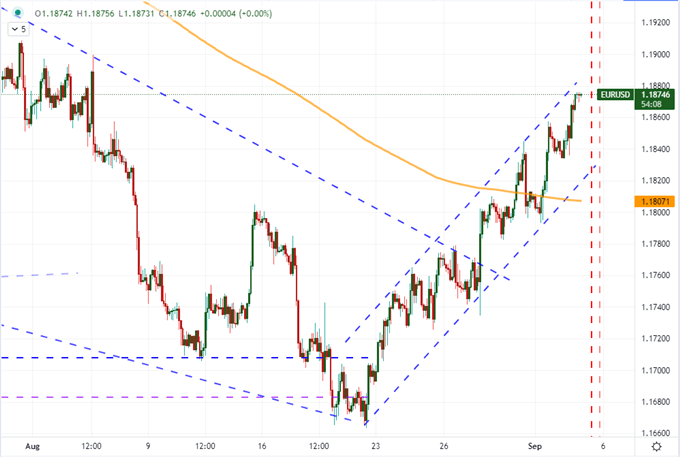
Chart Created on Tradingview Platform
If I’m looking for a Dollar-based cross that holds more potential for a further battering of the benchmark currency, the very recent slip through support from USDCAD looks a better candidate than EURUSD which has earned significant progress through the past few weeks. Should the employment statistics meaningfully disappoint the forecast for a 750,000 net increase in payrolls – and ideally the service sector report misses – a further break below the 50-day moving average could be another milestone to urge bears along.
Chart of USDCAD with 50-Day SMA (Daily)
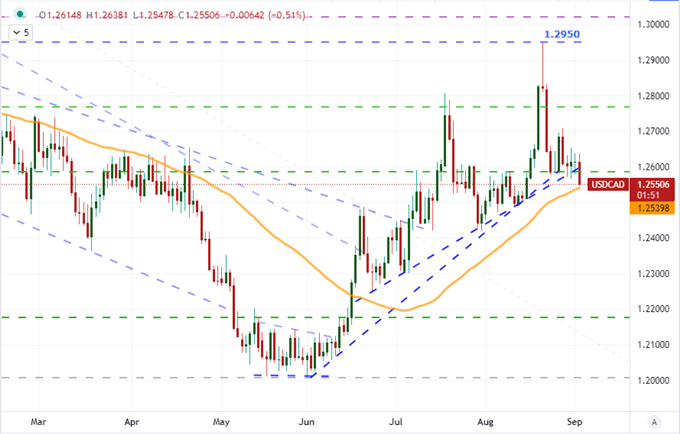
Chart Created on Tradingview Platform
I am a person that likes to account for different scenarios. That said, I can see the varying virtues of a Dollar bearish outcome from the collective event risk ahead; but the list of Dollar bullish pairs isn’t as clear. A pullback from EURUSD or AUDUSD may check us back into an established range like a quickly uncoiling spring, but the technical potential is inherently limited. A pair like USCAD would just present a mess in a false breakout reversal. USDJPY is an interesting alternative candidate with a symmetrical wedge within a broader 111.50 – 109.00 range. A bullish show for the Dollar could offer an upside break, but it is important to account how benefit to the currency may be interpreted for risk conditions as these can be offsetting projections in their rudimentary form.
Chart of USDJPY with 100, 200-Day SMAs and 10-Day ATR (Daily)
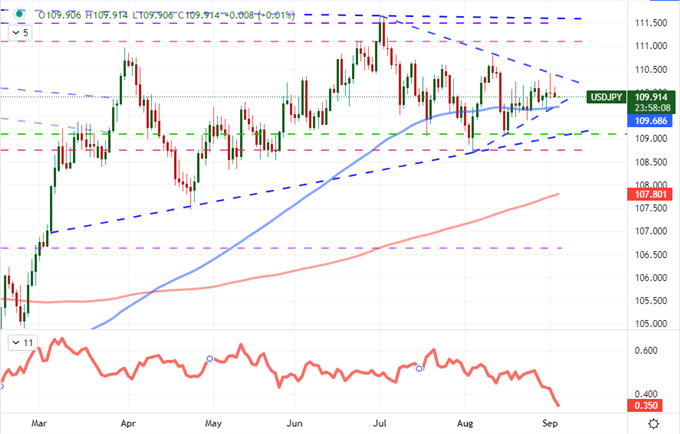
Chart Created on Tradingview Platform


