


SPDR Dow ETF, EURUSD, NZDUSD, GBPUSD and USDCAD Talking Points
- Fed Chairman Powell’s town hall proved a dud for traders looking for clearer insight on the central bank’s intentions for policy with critical dates ahead
- Nevertheless, the Dollar advanced to critical levels for DXY and EURUSD – despite additional data – which makes today’s FOMC minutes make-or-break material
- Meanwhile, risk assets took a hit this past session with the S&P 500 the a reserved participant; and further event risk raises potential for NZDUSD, GBPUSD and USDCAD

Another Dip Into Risk Aversion: From a Tentative Dow to a Critical EURJPY
Has the market passed the threshold of a bullish risk appetite coast into a measured speculative retreat? There was a fairly broad risk aversion registered across global indices, emerging market assets, carry trade and growth-sensitive commodities this past session. I consider both the breadth (correlation) and intensity of move oriented around sentiment to be among the strongest measures of a market motivated by the otherwise abstract sense of conviction. That matters because there are few means for developing system-wide trends, and this is at the very top of my list. That said, my skepticism for Wednesday and beyond remains. The stir in volatility is appealing for a trader like myself craving productive swings in liquid markets. That said, we are still passing through the summer doldrums and there still doesn’t seem to be a definitive fundamental backbone to the spill.
It would be convenient to fix on the Afghanistan headlines, Fed speculation or general growth concerns; but there really is nothing to suggest these are reliably under power. As my preferred, one-look speculative measures (when I don’t have time and want to see how resilient complacency is), the US indices were lower on higher volume this past session, but it wasn’t a definitive break. The SPDR Dow Jones Industrial Average ETF below broke a five-day streak, but it hardly looks like a capsize.
Chart of the DIA Dow Jones Industrial Average ETF with Volume and Consecutive Day Moves (Daily)
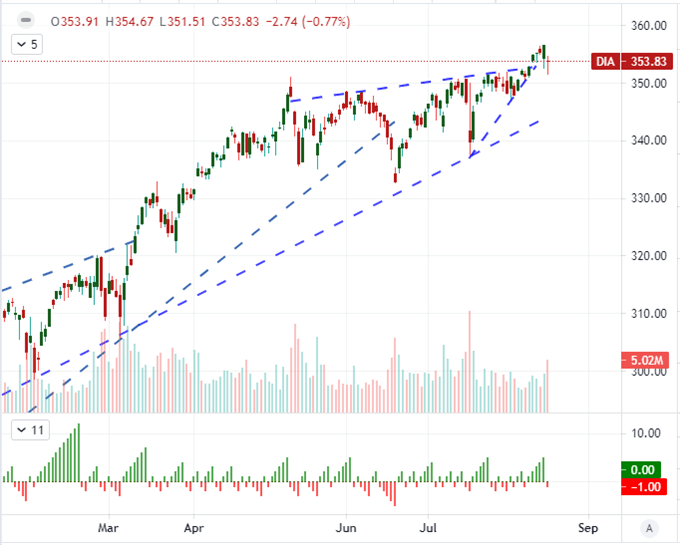
Chart Created on Tradingview Platform
There are plenty of alternative measures of ‘risk’ that present differing perspective on conviction – and some even for direction. European and Asian indices this past session were somewhat mixed for example. However, there is still swoon from the likes of 10-year Treasury yields, crude oil, emerging markets and FX carry trade. In that latter category, I have to highlight once again EURJPY. This pair managed to close below the 200-day moving average Monday for the first time in exactly 300 trading sessions. This past session we further slipped the range previous swing low in July at 128.50. Is this confirmation enough of follow through? For pure technicians that are frustrated by the lack of activity, it may be enough. For me, I’m dubious of outlier market moves – particularly when they conform to my own perspective for the longer-term, lest I be lulled into a sense of false confidence and a losing trade. On the other hand, if there is broader slide in sentiment, this is a productive participant to consider.
Chart of EURJPY with 200-Day SMA (Daily)
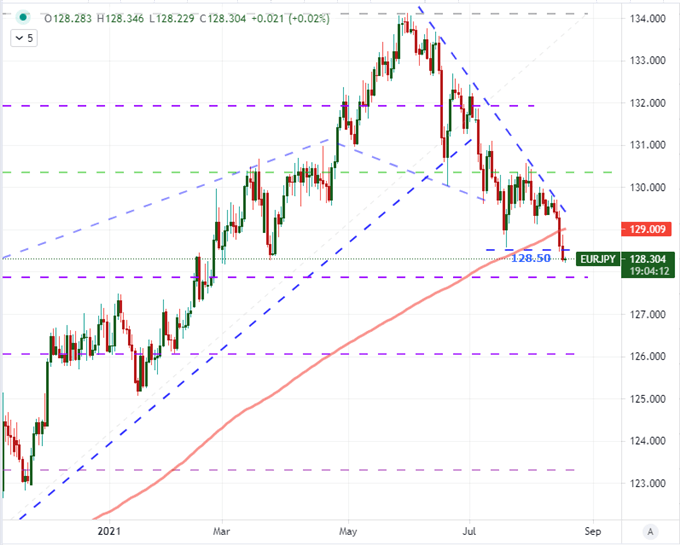
Chart Created on Tradingview Platform
Where the Fundamental Attention Will Find Conviction and Breaks
While the typical end of the summer doldrums may be not too far out, I still look for fundamental motivations to really garner a sense of norm breaching. While the announcement of anti-competitive crackdowns in China and the rise in coronavirus cases globally (leading to a New Zealand shutdown and Chicago indoor mask mandate), these don’t seem to carry the weight that they may otherwise exert in a busy backdrop. Earnings is still an interesting theme with this past session’s pre-open docket offering up Walmart and Home Depot reports to weigh in on the retail group post-pandemic and reopening. Both beat on EPS, but the latter saw a shortfall in same store sales that suggests the DIY binge is over and perhaps the unique stay-at-home spending trends of the past year. There is still plenty ahead with Target and Lowe’s on tap Wednesday with more behind these players. I will look for isolated volatility but the global implications of fading sales forecasts may still struggle for grip.
Chart of Home Depot with 20-Day SMA and Volume (Daily)
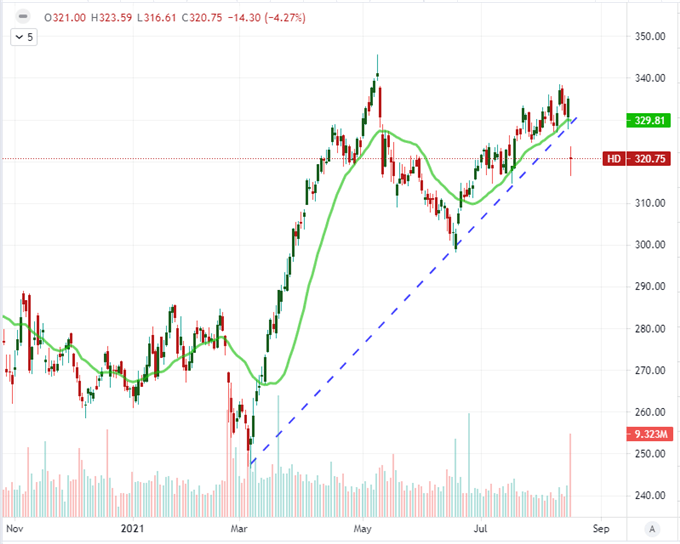
Chart Created on Tradingview Platform
A more productive theme over the past months is monetary policy – and no central bank nor country has the same kind of speculative clout as the Fed and US. This past session, there was a lot of expectation heading into Fed Chairman Jerome Powell’s townhall with teachers (much of it from myself). Yet, the policymaker would snub the opportunity to help shape expectations ahead of more critical dates in the Jackson Hole Symposium starting next week and September 22nd rate decision. Despite the lack of clarity from Powell – and the disappointment in retail sales Tuesday – the Dollar still managed to climb to its 9 month range border with EURUSD at 1.1700 support. The townhall was a market dud, but it makes the next move a far more amplified possibility. The FOMC minutes will offer detail with some insight into the general favor for next policy steps from the crew. However, if it falls short of rallying the Dollar bulls, the anticipation can spur a more forceful reversal in disappointment.
Chart of EURUSD with 50-Day SMA and 1-Day Rate of Change (Daily)
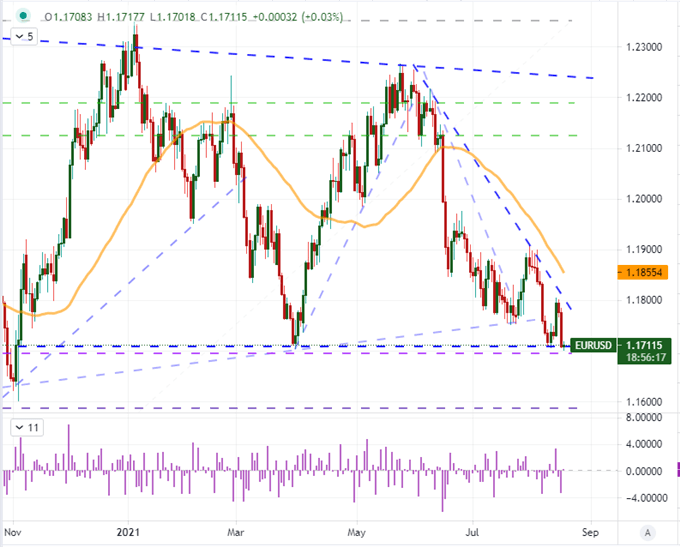
Chart Created on Tradingview Platform
Outside of Fed Speculation, There Is Discrete Volatility to Monitor
Fed policy isn’t the only effective fundamental theme ahead, but it is one of the very few matters that I consider to represent the heft necessary to generate wholesale trends. And yet, that is not the full extent of what lies ahead. There is plenty of opportunity to be found in more isolated events and their measured impact on particular vehicles. I start with the RBNZ rate decision this morning which ended in a hold of the benchmark at 0.25 percent when less than 48 hours earlier, economists and markets were certain that a 25bp hike was on tap. Then the economy was pushed into lockdown as cases of the Delta variant of the Coronavirus were reported in the country. The hit to the Kiwi was swift, but yet again, it has not resulted in follow through as can be seen in the AUDNZD daily chart below.
Chart of AUDNZD with 20-Day SMA and Daily ‘Wicks’ (Daily)
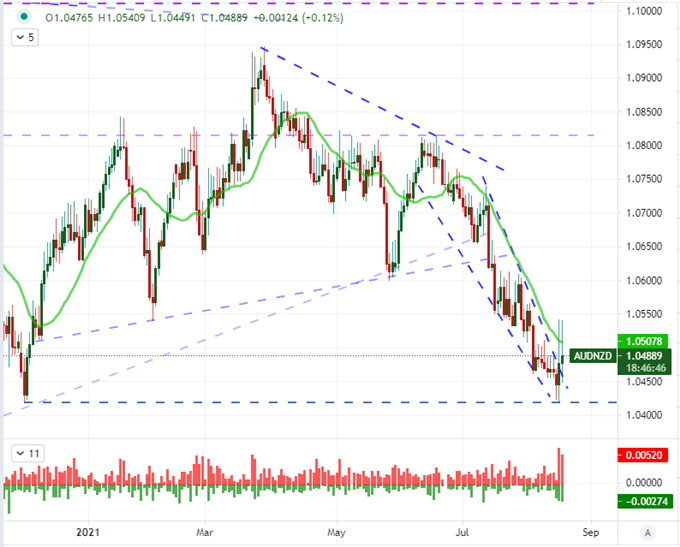
Chart Created on Tradingview Platform
Another active but perhaps less intense actor was the British Pound. This past session saw a fairly robust run of UK employment data with the claimant count change in July dropping -7,800 after the -114,800 the month before with a tick down in the jobless rate to 4.7 percent and rise in average earnings to an 8.8 percent clip. Nevertheless, the Sterling dropped versus Dollar and Euro among other crosses. I like the technical implications for Cable (GBPUSD) as it pushed the pair below 1.3800 and into the range of a ‘right shoulder’ on a head-and-shoulders pattern that stretches down to 1.3600 roughly. Perhaps the upcoming inflation data will help it along. I will watch the Pound pairs.
Chart of GBPUSD with 100-Day SMA and 1-Day Rate of Change (Daily)
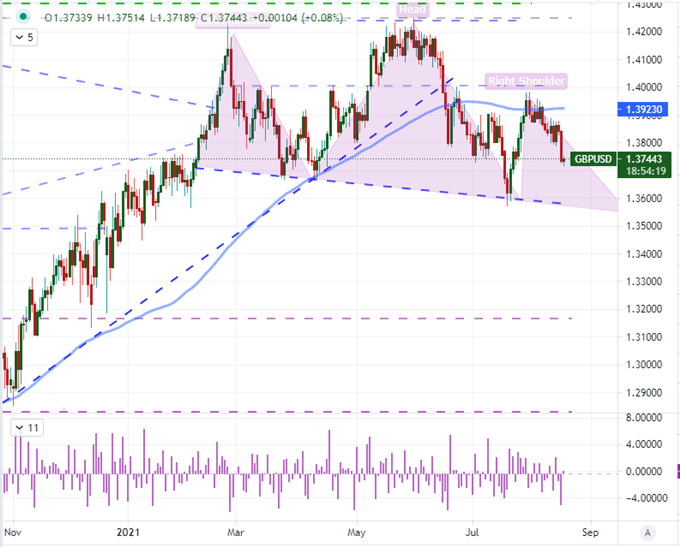
Chart Created on Tradingview Platform
Along similar lines, I’m keeping a close tabs on Canadian consumer inflation (CPI) which is due before the official North American session open Wednesday. While much of the attention is on the Fed and when it will actually move, the Bank of Canada (BOC) has actually tapered twice and thereby finds itself well ahead of the curve. This makes the fodder for local monetary policy even more interesting and a live wire for the likes of USDCAD.
Chart of USDCAD with 50 and 100-Day SMA (Daily)
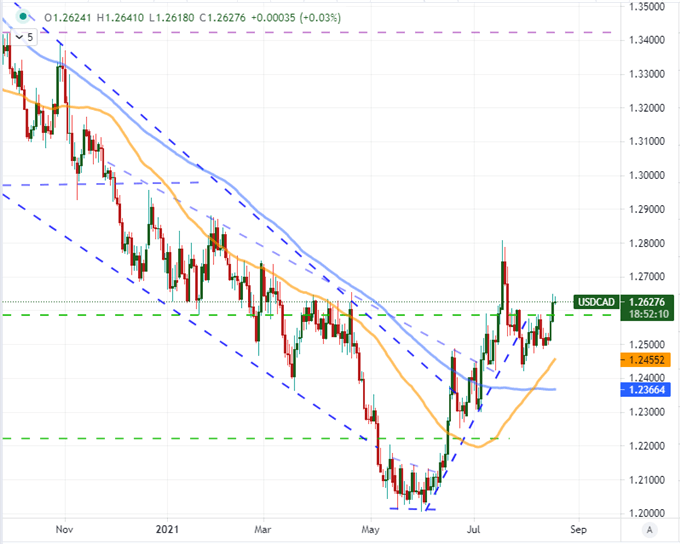
Chart Created on Tradingview Platform


