


Amazon, Nasdaq 100, Dollar, USDCAD and EURUSD Talking Points
- With the afterhours release of Amazon earnings, we have rounded out the FANGs and the consensus for speculative appetite is notably troubled
- In the aftermath of the Fed’s cautious shift towards hawkishness, the US GDP printed a robust 6.5 percent in growth – still a Dollar disappointment against 8.4 percent forecasts
- The Dollar has dropped for four consecutive trading sessions, producing notable breaks back into range for EURUSD and USDCAD, but potential for these pairs is very different

The FANGs - The Pandemic Speculative Darlings - Are Showing Struggle
Some of the most prominent risk benchmarks are pushing record highs such as the S&P 500 and Dow Jones Industrial Average. Other measures are in various states of uncertainty as they track lower than their respective records and multi-year highs – DAX, FTSE 100, EEM, HYG – but in general, there remains an underlying buoyancy to the markets. Yet, where the markets may be holding a bullish course setting, progress continues to flag despite the seeding of event risk that can be interpreted as favorable if the market so chose. Through this week’s Fed assurances of an accommodative policy stance and this past session’s robust US 2Q GDP update, the lack of progress in a readily bullish market raises concern. One of the more worrying disconnects from my perspective is the notable slump in which the FAANG members have found themselves. Facebook, Apple and Google all beat headline expectations earlier this week; and yet they have all failed to produce follow through. Amazon was the last of the crew to report Thursday afterhours. Once again, the company beat expectations of a $12.28 earnings per share (EPS) with a robust $15.12 figure. Nevertheless, shares tumbled afterhours largely on the basis of a weaker 3Q outlook.
Chart of the Amazon Stock Price with 20-Day SMA (Daily)
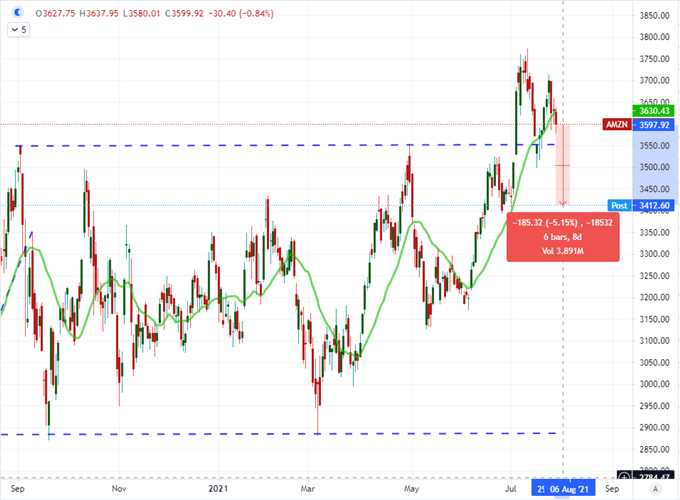
Chart Created on Tradingview Platform
The post-pandemic recovery has been extraordinary. In the wake of the most abrupt recession and collapses into a bear market in modern record, the S&P 500 has rallied 100 percent from its trough in approximately 340 trading days. What makes it even more impressive is the breadth of the climb. Risk assets of different types and across different regions have charged higher. That said, as we weigh the market’s enthusiasm to push already-ebullient markets even higher, it is worth looking at comparisons of performance for signs of speculative fissures. One of the more consistent relationships that I’ve tracked over the past year is the performance of the tech-heavy Nasdaq 100 relative to the broader US stock market. As the FAANG’s flag, this ratio naturally wanes. The next level down for peak speculative appetite is the comparison of US indices relative to the rest of world stocks (the Nasdaq 100 relative to the VEU ETF is below). While risk appetite broadly has settled these past few months, there has been an unmistakable drive to favor even moderate momentum seen through this ratio. So, when this ratio starts to retreat even as markets are broadly holding up; it should draw greater scrutiny.
Chart of the Nasdaq 100 with 20-Daily Moving Avg Overlaid with Nasdaq-VEU ETF Ratio (Daily)
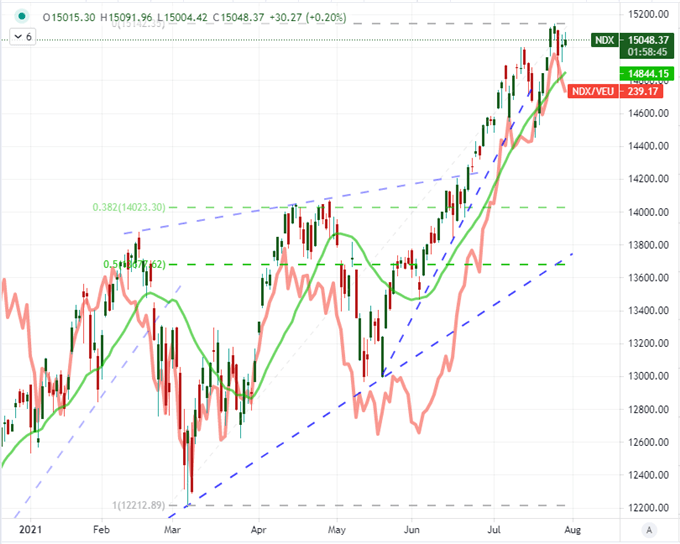
Chart Created on Tradingview Platform
The Top Fundamental Themes of Yesterday and Tomorrow
Through this past session, the focus remained on the US markets as investors were ready to weigh the country’s economic health following the heavily debated FOMC rate decision. While not as complicated as the central bank’s methodical retreat from its extraordinary monetary policy effort, the US 2Q GDP figures definitely had points for interpretation. Overall, the 6.5 percent clip of growth is historically remarkable. While not as fast-paced as the 3Q 2020 measure, that was an extreme that reflected the intensity of the recession the previous period. In these more recent readings, we are moving from the recovery tempo to open-field growth. Extending the expansion becomes increasingly important as indices loiter at record high costs and expectations start to bend to the reality of a plateau. It is against this backdrop that such a remarkable reading disappoints against a forecast of 8.4 percent. US indices didn’t fully capsize on the data, but the Dollar certainly took the hit. Growth is still a matter of contention moving forward. The US has last month’s personal spending figures, but there are official 2Q GDP readings from the Eurozone and key member countries, Mexico and Hong Kong. There is even a May Canadian growth update.
Chart of Real US GDP (Quarterly)
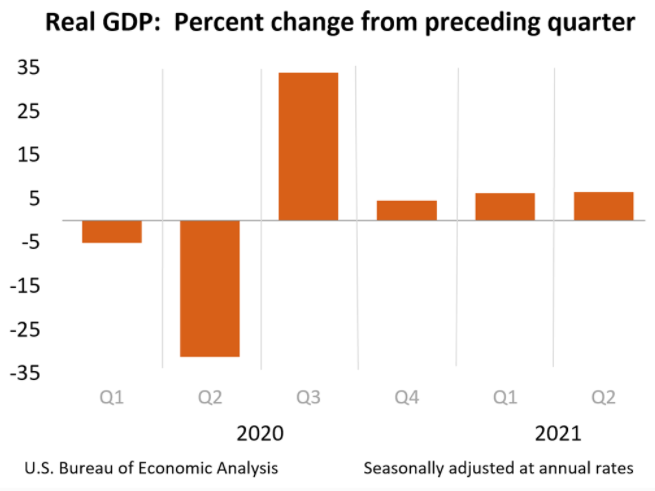
Chart from BEA.gov
As broad as the growth update may be through Friday’s docket, it is possible that the market may place greater emphasis on a single event on tap: the PCE deflator. Though not as recognizable to most investors the world over, this is the Federal Reserve’s preferred inflation indicator. After the FOMC decision earlier this week in which they offered language to acclimatize the market to an eventual taper, the market further read into the written and spoken remarks a greater emphasis on the data making the call for timing. The Fed has been on a campaign to raise the importance of full employment, but inflation is the ‘risk’ for the group. Core PCE is expected to accelerate further to a 3.7 percent pace which would only further boost the anticipation of a August or September taper announcement and a first hike by 2022. That could help pull the Dollar out of its recent four-day dive – an infrequent event. On the other hand, if the pace cools, it could further fuel the move back into range.
Chart of DXY Dollar Index Overlaid with Consecutive Candles and Fed Implied Hikes Dec 2022 (Daily)
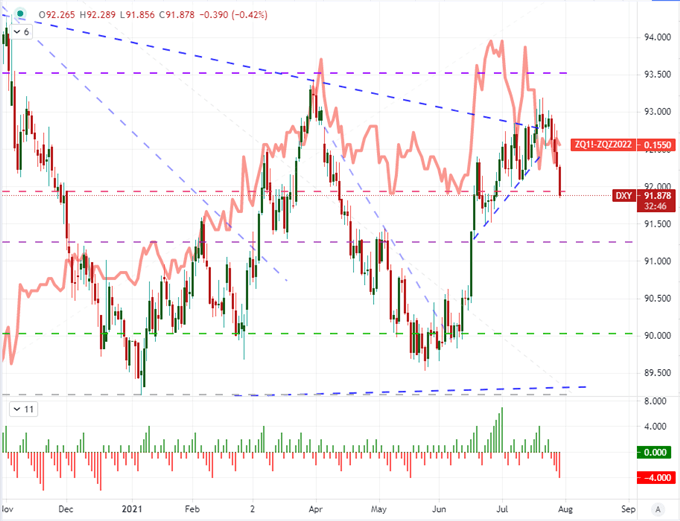
Chart Created on Tradingview Platform
The Technicals Still Raise Look Most Appealing on USDCAD and EURUSD
Overall, I prioritize my analysis to first evaluate market conditions (volatility, liquidity, trend ability) and then consider the technical and fundamental opportunities with an equal ranking. Ideally, I like to find situations in which scenarios have all three elements in their favor. With that mix, USDCAD is my preferred outlet heading into Friday. From a market conditions perspective, the pair’s recent break below the 20-day moving average – after the longest run above the moving trendline in multiple years – notched a range correction. Ranges are more practical scenarios with the market conditions we current face. Technically, the 1.2500 former support is new resistance while there are layers of support measures below including the 100-day moving average at 1.2365. Fundamentally, the PCE deflator is the principal concern which can sharpen the focus. A weak inflation reading would be most productive given the other circumstances, but I am not operating with that expectated outcome.
Chart of USDCAD with 20 and 100-Day SMA and 20-Day SMA Disparity Index (Daily)
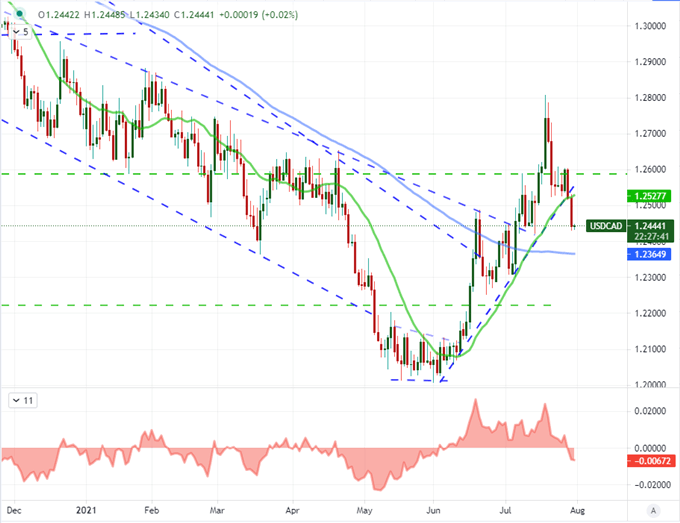
Chart Created on Tradingview Platform
On both a market condition and technical basis, EURUSD extols much the same virtues. After one of the most constricted periods of congestion in a few years (at the bottom of a large wedge), we have seen a bullish break back above the 20-day moving average. A technical break that moves us back into range. However, the sticking point for me on this pair is the abundance of event risk. Not only do we have the US data on tap, but we also have the run of 2Q GDP stats for multiple European economies along with the Eurozone’s CPI update – and these are certainly times of monetary policy scrutiny. While it is possible that all of this data aligns to the same bullish or bearish view for EURUSD, that is an impractical expectation going into the run.
Chart of the EURUSD with 20-Day SMA and 20-Day Historical Range (Daily)
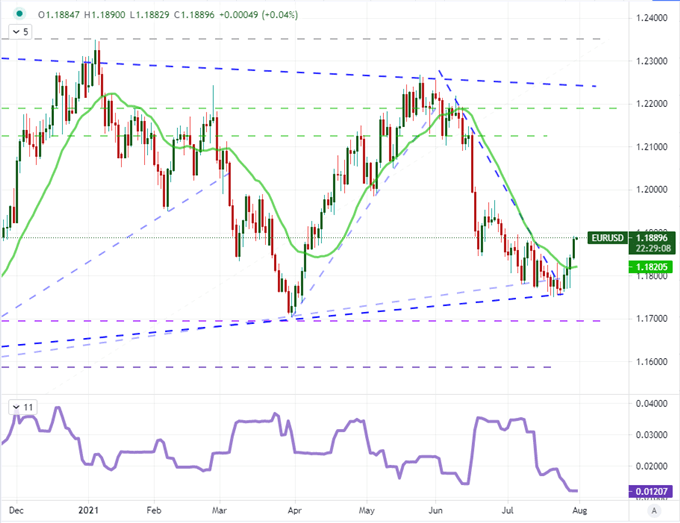
Chart Created on Tradingview Platform


