


SPY, Facebook, EURUSD and USDCAD Talking Points
- The Federal Reserve’s policy meeting ended with no change in rates or stimulus pace, but the group signaled it is closing in on the taper
- With speculation around an August, September or later taper timeline; the S&P 500 struggled after the event…but so did the Dollar
- EURUSD closed above its 20-day moving average for the first time in 36 trading days while USDCAD is carving out of its smallest 5-day trading range in a year

Despite the Fundamental Detonation, We Still Lack Speculative Clarity
The FOMC (Federal Open Market Committee) rate decision has moved us closer to the heavily-anticipated taper in the Fed’s bloated balance sheet and by extension the first rate hike since January 2019. Yet, you wouldn’t know it from price action alone. From risk assets represented by US indices, there seemed to be more chop and confusion than fallout from fear that the external support system would soon start to reverse course. Even more surprising, the presumed forward yield advantage for the Greenback would fail to materialize, instead seeing pairs like EURUSD and USDCAD move against the Dollar and back into range. It isn’t that this step wasn’t meaningful nor that there was perhaps deep controversy around the actual steps the central bank is laying out. Instead, we see in the market it’s reticence to commit to the reversal still months away. Nevertheless, there is recognition that the countdown is in place, and that will amplify the impact of key events still ahead including the US 2Q GDP due later today or the Fed’s favorite inflation indicator on tap for Friday. As such, the volatility we’ve seen from the likes of the S&P 500 ETF (SPY) should be monitored closely in case the activity starts to catch for a specific committed bearing.
Chart of the SPY S&P 500 ETF with 100-Week Moving Avg, Volume and ‘Wicks’ (Daily)
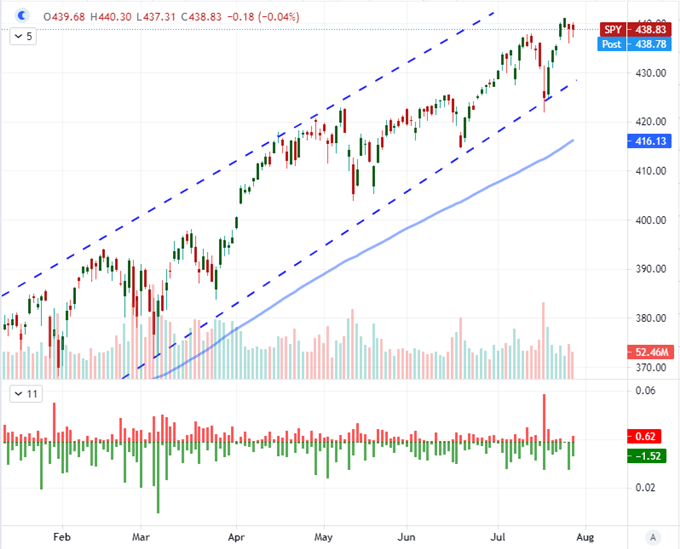
Chart Created on Tradingview Platform
While US monetary policy was a key event risk this past session, it wasn’t the only matter pulling traders’ fundamental interests. The activity trade following Tuesday after-the-close earnings reports seemed to show the market’s appreciation for the macro event risk that was still ahead. Google, Apple, Microsoft and AMD all bested their respective EPS consensus forecast (though forecasts have been somewhat wanting), but with the exception of the chipmaker, the they were in varying stages of retreat. The first major listings after the US central bank had it say leave us with a clue as to how willingly the markets will turn back to corporate performance. FANG member Facebook beat expectations on earnings per share with $3.61 versus $3.01 expected while Ford reported a $0.13 EPS against consensus for a -$0.05 loss. The former saw shares suffer a hefty after hours drop owing to a distinct drop in guidance, which bodes poorly for the post-pandemic power of major tech firms. Alternatively, the car manufacturer is a closer gauge of economic activity, consumption and inflation concerns. I’ll watch the chart for F far more closely Thursday on the open. That said, Amazon’s reporting after the subsequent session’s close will be the top earnings update in my radar for the season.
Chart of the Facebook Stock Price with 100-Day SMA and Volume (Daily)
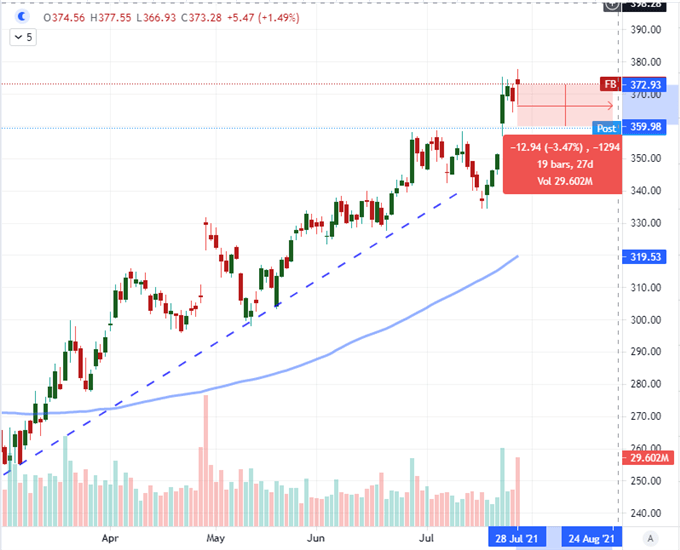
Chart Created on Tradingview Platform
The FOMC Decision Will Hold Over the Markets Moving Forward
The Fed fully met expectations while still moving closer to the opening move a true normalization of monetary policy. As full expected, the central bank held its benchmark rate range just above the zero mark. The real interest was in the brief statement from the central bank and the rhetoric from Chairman Powell at his press conference. In the official wrap, the group stated the “economy has made progress toward [its] goals” for inflation and employment. These were remarks previously missing and yet very deliberate from a group that has been very meticulous in its signaling and forward guidance as a tool. There is still an ‘out’ in the caveat that the language does not match the ‘substantial progress’ it has set as the milestone and Powell stated that we are still a ways away from this goal. There was also the concern that covid’s impact on the economy was a risk but it represented less and less of an economic impact as time went on.
FOMC Rate Decision Scenario Table
Scenario Table Created by John Kicklighter
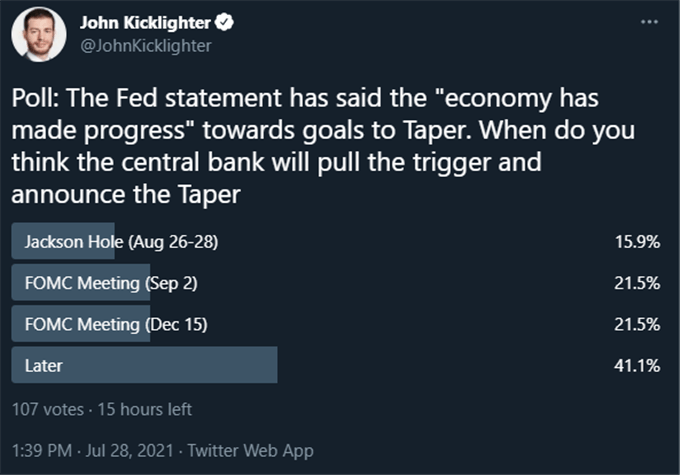
While the market is reticent to convert the Fed’s signaling efforts into immediate market movement, we have seen interest rate expectations pick up through Fed Funds futures. The difference between the December 2022 and active nearby contract is now pricing in 16 basis points of hikes through next year’s end from 14 just the day before. There is a carefully crafted plan at hand and raising benchmark interest rates is going to be a much later stage. Before that point, we will likely see a full taper and before that the official announcement. I asked traders on Twitter when they believed the Fed would make its announcement. And the majority believe it will happen sometime in 2023 or beyond. I personally believe the announcement will come with the September 2nd FOMC meeting with the updated forecasts. In the meantime, event risk through the rest of this week will take on a new perspective with policy timing in mind including Thursday’s GDP and Friday’s PCE deflator.
Chart of DXY Dollar Index Overlaid with Fed Implied Hikes Through Dec 2022 with 20-Day Correl (Daily)

Chart Created on Tradingview Platform
EURUSD Clears a Range Break and USDCAD is in Position
For price action after the event, I still believe EURUSD and USDCAD are the most interesting pairs. The former managed to close above its 20-day moving average for the first time in 36 trading days, breaking the longest streak of bearish momentum by this measure since November 2018. Such turns have seen either abrupt reversal or general turns previously. We seem to have conditions for the latter scenario, but this is plausible given that this pair is looking at a move to traverse a well established range. I’ll be keeping tabs on Eurozone confidence, German CPI and German employment as well today followed by the Euro-area GDP figures on Friday.

Chart of the EURUSD with 20-Day SMA and Disparity Index (Daily)
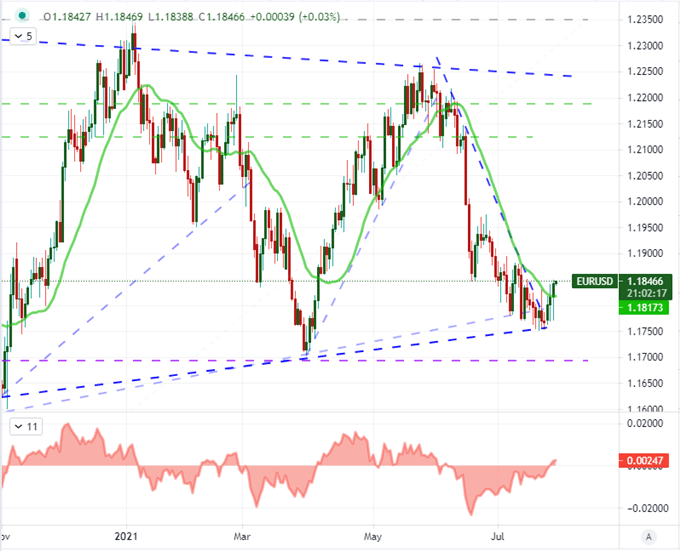
Chart Created on Tradingview Platform
USDCAD looks ready to follow EURUSD’s lead with a move back into range. The pair ended Thursday without a critical break of a tight five day range. In fact, this is one of the most restrictive week-rolling trading bands for this pair over the past few years. A break probability only climbs with each day we spend in this 70 pip range, but follow through will struggle to extol fast-paced momentum commensurate to the conditions we continue to deal with.
Chart of USDCAD with 20 and 100-Day SMA and 5-Day Historical Range (Daily)
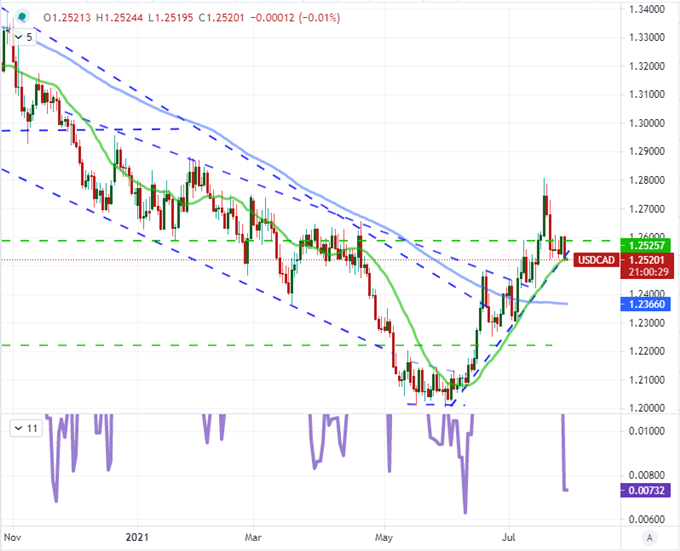
Chart Created on Tradingview Platform


