


S&P 500, Dollar, EURUSD and GBPUSD Talking Points:
- A technical breakdown for the S&P 500 nor market-wide slump in risk trends was enough to metabolize Monday’s risk aversion
- Fundamental motivation may be secondary when risk trends are underway, but they can be critical when liquidity is working against progressive market movement
- The Dollar is deviating widely from implied Fed Fund rate forecasts, but is that a sign of strength or a countdown to a soon-to-stall run?

Liquidity Is Too Strong an Anesthetic and ‘Buy the Dip’ Traders Too Confident
We are heading into Wednesday trade a recovery mentality running through the market. Yet, considering the charge follows the one of the broadest and steepest retreats in risk appetite in months, the ambitions of those participating in the bounce is more likely to end at a ‘buy the dip’ attempt rather than commitment to a renewed advance in speculative assets. That will likely frustrate many traders regardless of a bullish or bearish bias as the curb is on follow through. From the S&P 500 – my preferred, imperfect, one-look risk measure – a -1.6 percent tumble followed by a 1.5 percent rally following months of heavy inactivity registers more as a natural correction rather than any move of intent. Sticking with this benchmark, I’ll wait until the 4,400 record high or the 50-day moving average at 4,240 give before taking any stance of conviction.
Chart of the S&P 500 with 50 and 100-Day Moving Avgs and Daily Change (Daily)
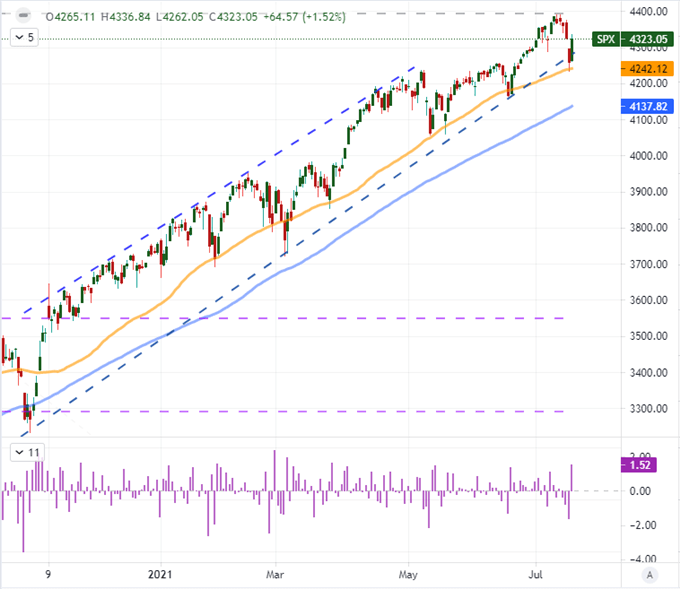
Chart Created on Tradingview Platform
Of course, my preferred measure of sentiment is not a singular asset in a particular country – even if it is the foundation for the most heavily traded derivatives and representative of the world’s largest market. Instead, I like to reference a range of assets to suss out an underlying current that is most likely to tie into one of a very few systemic influences, the most representative of which is risk trends. The correlation across global indices, emerging market assets, carry trade and other markets remained through Tuesday; but the recovery is still the first step of a climb. Then again, it is a move back into a range which is a ‘path of least resistance’.
Chart of Risk Assets 12-Month Performance (Daily)
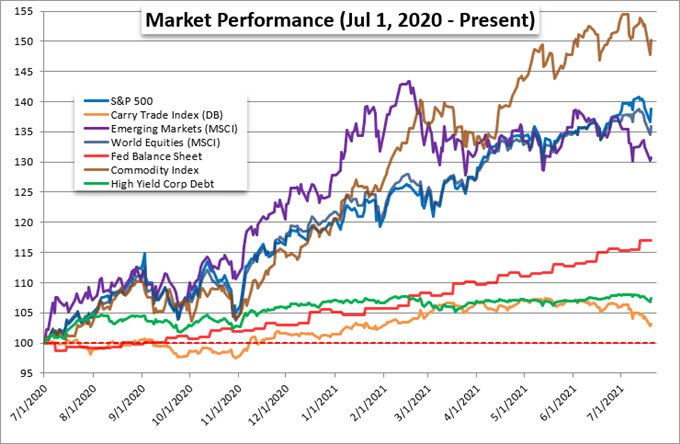
Chart Created by John Kicklighter with Data from Bloomberg
If We are Due Another Tumble, It’s Best Served By One Of These Risks
Despite the latest upswing in sentiment putting wind to bulls’ backs, I still believe this course setting draws the greatest struggle for follow through. With so many assets so close to record or multi-year highs, the comfort of falling back into complacency in line with the doldrums is too strong for bulls. Alternatively, if the bears were able to muster a second run, fear that the ‘long overdue’ deleveraging will begin when markets are thin could readily catch fire in these dry conditions. If this is going to happen, it would most likely occur in relation to a systemic fundamental theme. Recognition of a slowing economic recovery and the gradual shift in monetary policy are prominent concerns but there is little urgency at present. From my poll, it seems most traders believe the rise in coronavirus cases through the delta variant was the most tangible risk in Monday’s slide. It is reasonable to suspect that this could cause problems again.
Twitter Poll on What Was Driving Monday’s Risk Aversion
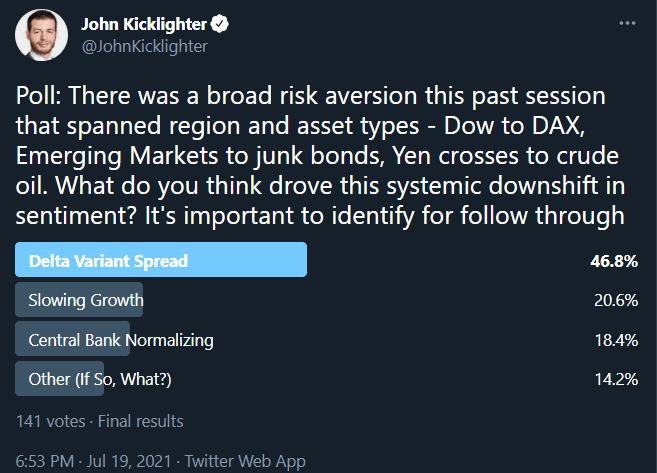
Poll from Twitter.com, @JohnKicklighter
Looking more broadly than just my poll, Google search interest seems to further support a greater concern around the traction of the delta variant. In the United States this past month, we have seen search around this particular term readily overtake ‘growth’ and ‘inflation’ (the principal driver of rate hike fears). This is a useful tool for gauging fundamental drivers, but I will be looking to headlines for a more immediate gauge of where the crowd is herding.
Google Search Trends for Inflation, Delta Variant and Growth (Daily)
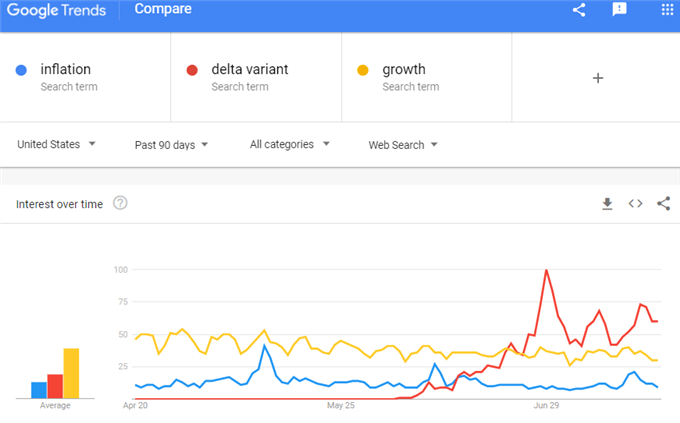
Chart from Google Trends
The Dollar Defies Its Safe Haven Role and Monetary Policy Dependencies
While the rebound in the S&P 500 and its peer risk assets is perhaps not very surprising, it is remarkable to see the Dollar continue its coast higher. This is a drift that has carried the DXY Dollar Index through range resistance that stretches back 8 months. The technical level is less important in this equation than the fundamental backdrop. If risk assets have recovered, it seems the Greenback is throwing off any pretense of playing a safe haven. What’s more, the implied yield through the end of 2022 via Fed Fund futures has also collapsed lately to 13.5 basis point. That puts us nearly at a 50/50 probability of a hike by the end of next year when it seemed all but locked up a week ago.
Chart of DXY Dollar Index with 20-Day Moving Average Overlaid with Fed Implied Rates (Daily)
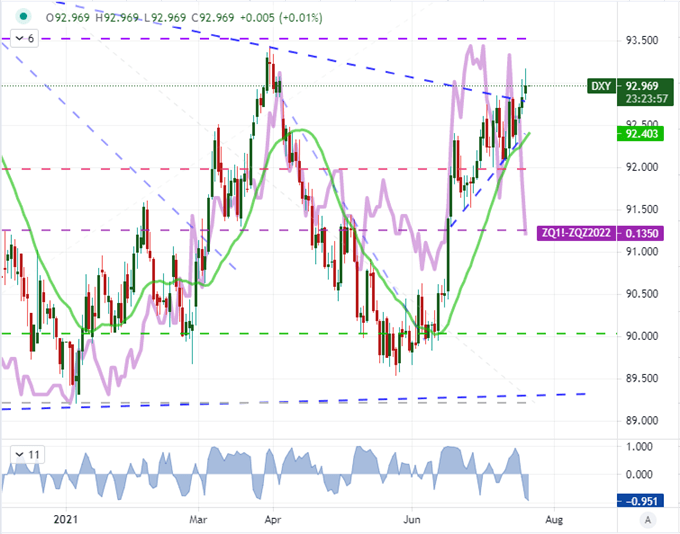
Chart Created on Tradingview Platform
I am dubious of the Dollar’s ability to keep up its rally. The concern is not that the bulls can keep the steering wheel, but the ability to command a strong move looks very suspect when the rest of the market continues to struggle with the seasonal effects. A pullback for the currency seems the more productive scenario, but it is important to keep reasonable expectations for whatever bearing we take. For EURUSD, the 15-day historical range continues to plumb restriction not seen since the beginning of last year so a reversion to mean seems reasonable. That said, this pair is slow even on the turns – when they do occur. There is also the anticipation for Thursday’s ECB rate decision to take into consideration. I’ll look for a 20-day moving average break, but my preference for a Dollar slide is a pair like USDJPY.
Chart of the EURUSD with 20 and 15-Day Historical Range (Daily)
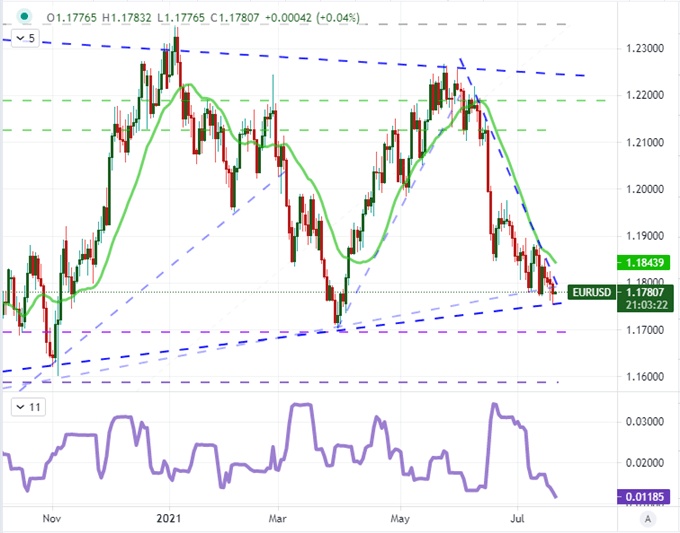
Chart Created on Tradingview Platform
Of course, it is always useful to have an option for alternative scenarios. One of the most prominent courses to take is a market that simple turns to chop, but the opposite extreme of a Dollar extension raises some interesting technical progressions. The USDCAD break’s recent break above the 200-day moving average and AUDUSD extension on a slow head-and-shoulders breakdown now to 0.7300 are each impressive. However, the monetary policy considerations on these crosses don’t abide well either a recovery in risk appetite or a refocus on monetary policy. GBPUSD on the other hand has its own impressive technical clearance of support and 200-day moving average (at 1.3750 and 1.3690 respectively) and it doesn’t have the fundamental baggage. Interestingly, retail FX traders at IG are leaning hard against the breakdown with the biggest net-long position seen in at least a year.
| Change in | Longs | Shorts | OI |
| Daily | 3% | -7% | -3% |
| Weekly | 4% | -10% | -5% |
Chart of the GBPUSD with IG Speculative Positioning (Daily)
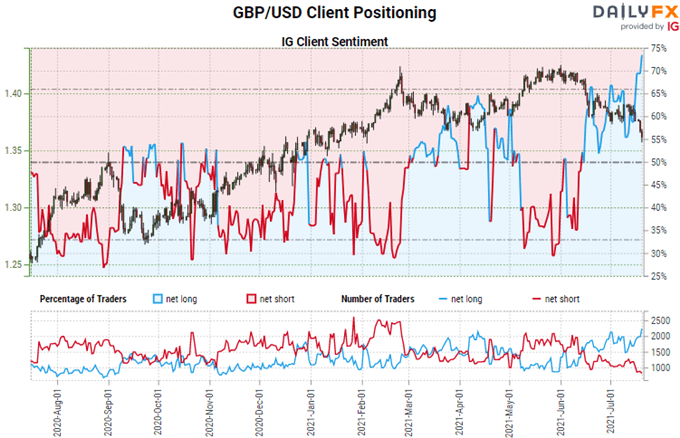
Chart from DailyFX.com with IG Data
.


