


Nasdaq 100, Yields, Dollar, AUDUSD and Yen Crosses Talking Points:
- Liquidity has returned after an extended US holiday weekend, but greater market depth wouldn’t lead to a consistent trend for the likes of the S&P 500
- While the Nasdaq 100 was one of the few notables that would show a ‘risk’ advance, Yen crosses presented a broad ‘risk aversion’
- The June ISM service sector activity report slid sharply, leading to a notable drop in rate forecasts and Treasury yields…but not the US Dollar

With the Return of Liquidity After the Holiday, The Return of a Preference
Markets filled out after the extended holiday weekend in the United States this past session. While the broader sense of indecision that has developed as a structural restraint these past months remains, there was a definite volatility in some key markets that deserves our closer attention as the week carries on. In particular, my attention will continue to be drawn the US Dollar which has defied an unfavorable job in interest rate forecast, a few currencies where monetary policy normalization is already underway and the Yen crosses where the lean into risk aversion has been strongest recently. Then of course there are the US indices. On the one hand, the S&P 500 posted its first bearish close in eight consecutive trading days, ending the longest bull run in months. Previous iterations of such rallies didn’t trigger a heavy reversal, so I will not be reading to heavily into that shift. On the other hand, the mid-day recovery from the Nasdaq 100 – and to a lesser extent its local peers – suggest the ‘buy the dip’ mentality remains a formidable force. The tech-heavy index put in for a 1 percent intraday recovery from lows Tuesday that left a larger lower wick.
Chart of the S&P 500 with Consecutive Day Moves and 6-Day ATR (Daily)
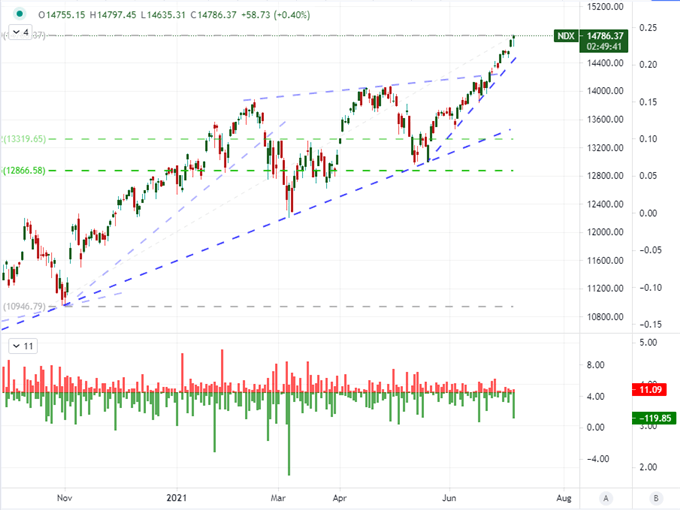
Chart Created on Tradingview Platform
Another critical look at the NDX is the heft of its charge relative to its counterparts. As a measure for ‘growth’ (the way that equity investors use that term), its performance relative to the ‘value’ Dow Jones Industrial Average registered a one percent rally for the ratio. That pushes this relative measure to its highest level since mid-February, extending a nearly critical technical breakdown two months ago. This same performance relative to other risk-oriented assets – global shares, emerging market assets, carry trade, etc – is even more exaggerated. While some would suggest that is relative value at work, I believe it is a devolving appetite for sheer momentum.
Chart of the Nasdaq 100 to Dow Jones Ratio (Daily)
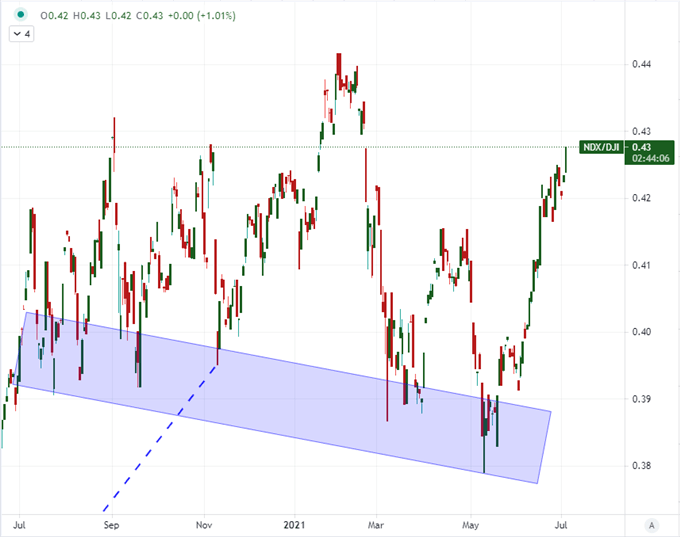
Chart Created on Tradingview Platform
The Reading for US Growth Cools and So Does Its Rate Forecast
Top event risk with the US markets back online this past session was the release of the ISM’s service sectory activity report for June. The United States is the world’s largest economy while its service sector is the largest source of output within the economy. Thereby, this particular indicator reflects heavily on the overall economic health of the critical economy where the official 2Q GDP reading is not due for weeks. Following in the footsteps of the manufacturing miss this past week, the service sector reading slowed far faster than expected with a drop from 64 to 60.1 (the economist forecast was for 63.5). Still well above 50, that doesn’t sour the optimistic mood too much, but the employment reading dipped into contractionary territory (to 49.3) and the prices paid component dropped 1.1 points to 79.5.
Chart of S&P 500 Overlaid with ISM Service and Manufacturing Activity (Monthly)
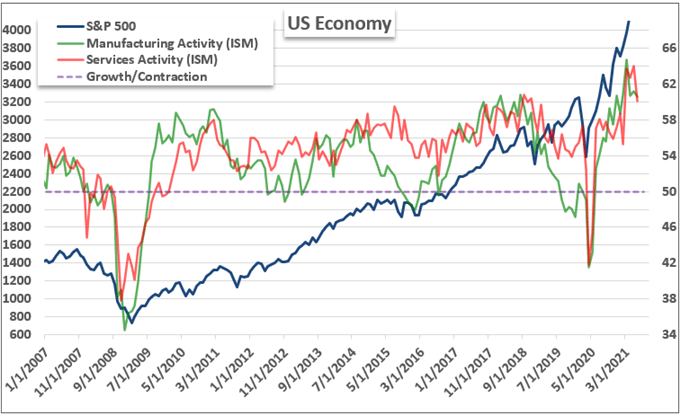
Chart Created by John Kicklighter with Data from ISM
The inflation component of the service sector activity report is particularly noteworthy for those assets highly tuned to interest rate expectations. Though still a considerable charge for the Federal Reserve to consider in its policy mix moving forward, there is at least some modest relief from the most urgent sense that a hike must come soon or risk entrenching troubling inflation. In turn, rate expectations implied from Fed Funds futures (difference between the December 2022 contract and active nearby) showed a further drop in forecast back to 18.5 basis points where we were testing 25 basis points (a full hike) late last week. In turn, the 10-year Treasury yield dropped below 1.40 to return to late-February levels. Despite this, the trade-weighted ICE Dollar Index (DXY) was meaningfully higher on the day. Perhaps that is owing to general anticipation for normalizing monetary policy globally or perhaps a sharp increase in sensitivity to safe haven demand, but it is particularly unusual. The 20-day correlation between the rate forecast through end of next year and the DXY has been exceptionally strong recently.
Chart of DXY Dollar Index with US 10-Year Yield and Implied Fed Rate Hike Through 2022 (Daily)
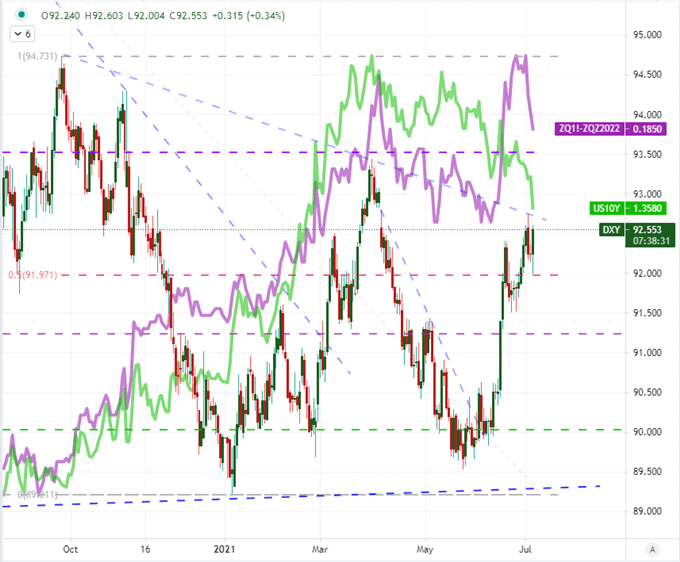
Chart Created on Tradingview Platform
Rate Speculation and Volatility
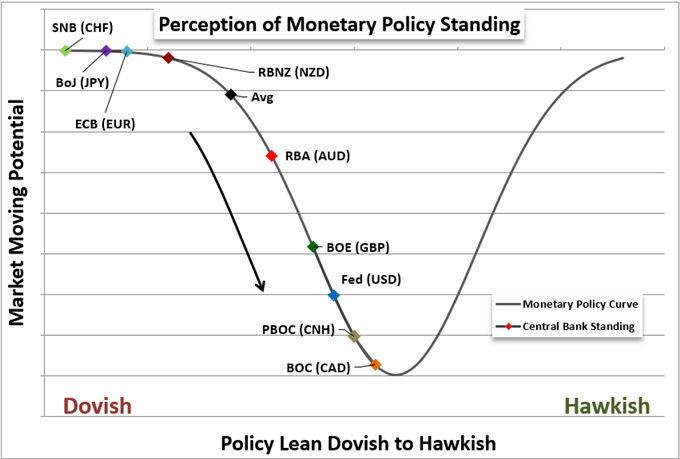
Looking at little more closely at monetary policy globally, there has been a notable shift from outside the US that may give greater leeway for the Federal Reserve to move forward with ‘normalizing’ without triggering the same kind of panic that ensued after the 2013 announcement of taper. Back in April, the Bank of Canada announced a reduction in its monthly asset purchases while a number of emerging market central banks (in Brazil, Mexico, etc) hiked rates in June. Adding to that momentum, the Reserve Bank of Australia (RBA) while dovish in its rate decision Tuesday morning made clear that it would reduce its weekly asset purchases (from A$5 billion to A$4 billion) starting in September. These are small but measurable and cumulative moves. Rather than the Fed being seen as going it alone and a contrast in terms of value, it may just be a larger component of a global move. We’ll need to see how the market evaluates this going forward.
Graph of Relative Monetary Policy Standings of Major Central Banks
Graph Created by John Kicklighter
Speaking of the RBA’s dovish reassurance with a spike of action, the Australian Dollar made an aggressive effort early Tuesday to rally back into the AUDUSD head-and-shoulders congestion pattern developed through almost all of 2021. That effort petered out, however, and left us with a very large upper tail or wick. That is an intraday reversal signal that many technical traders will recognize and focus on particularly given the ‘neckline’ of the H&S we are still debating over its influence. For this pair in particular, the USD’s rally certainly contributed to the reversal, but the Aussie’s retreat was measured in many other crosses. I’d suggest taking a look at pairs like AUDCAD and EURAUD as well.

Chart of the AUDUSD with 200-Day Moving Averages (Daily)
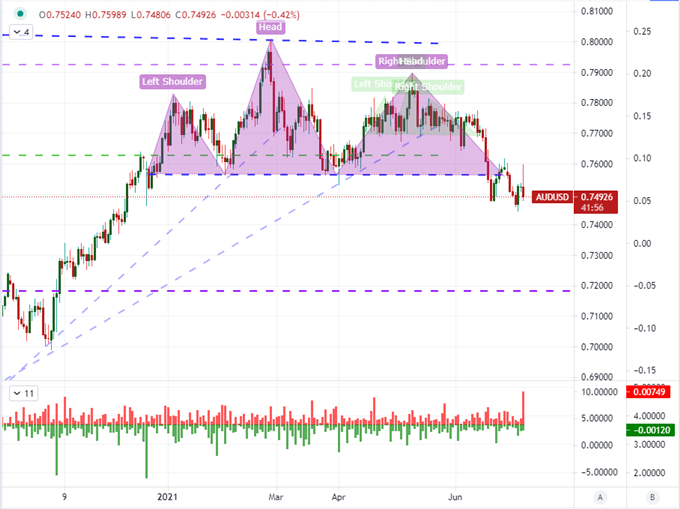
Chart Created on Tradingview Platform
Another standout from the Dollar-based majors was USDJPY. The Dollar’s strength was clearly not evident in this cross which may give greater weight to the safe haven appeal for other pairs like EURUSD. In general, the Yen crosses have seen a very productive slump through this past session. Some pairs like EURJPY are even attempting to clear support that stretches back to the pandemic reversal low. These pairs are either threatening a reversal or attempting to convince us with recent technical developments, but is that practical given our general constraints are market conditions. I’ll be watching these crosses particularly closely this week.
| Change in | Longs | Shorts | OI |
| Daily | -2% | 2% | 0% |
| Weekly | 12% | -16% | -6% |
Chart of the USDJPY with 100-Day Moving Average and COT Net Speculative Positioning (Daily)
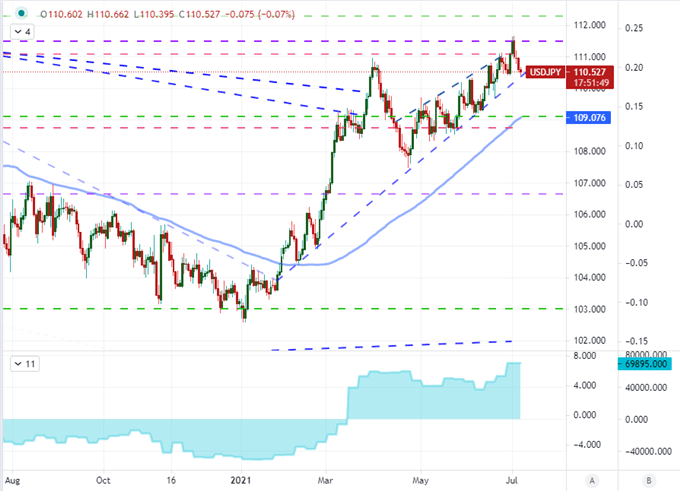
Chart Created on Tradingview Platform

.


