


S&P 500, NFPs, Dollar, USDJPY and AUDUSD Talking Points:
- The start of the new month and quarter may have helped carry the S&P 500 to a sixth straight advance and yet another record high
- With NFPs ahead, the Dollar has also found some modest charge – perhaps through IMF and CBO projections – but can breaks like AUDUSD and USDJPY run?
- Anticipation for the payrolls is curbing conviction, but what can this high profile event risk spur with the market fully expecting a quick liquidity drain into a holiday weekend?
Risk Appetite Continues to Climb Despite Liquidity Wall
The benchmark S&P 500 may not be moving quickly, but it is moving remarkable consistency. Despite the anticipation for the Friday US payrolls release and then an extended holiday weekend for the US – two enormous distortions for an already deflated liquidity backdrop – US indices as a measure of risk appetite have advanced. For the SPX, the tally is up to six consecutive bullish days, each close recording a record high. This happens to match the longest bull run since August 28, 2020; but it does so with the lowest register for the 6-day volatility (ATR) measure since holiday trade 2019 – and before that the extreme conditions of the second half of 2017. We may ultimately be heading for a repeat of that extremely arid market environment, but our fundamental backdrop is not nearly as sanguine as it was before the trade wars stirred the market back to life. Last August’s charge eventually led to a meaningful pullback, a move which could unnerve in the current backdrop of heavy rate speculation and value-price divergence. I expect low liquidity, but I’m ready for something different.

Chart of the S&P 500 with Consecutive Day Moves and 6-Day ATR (Daily)
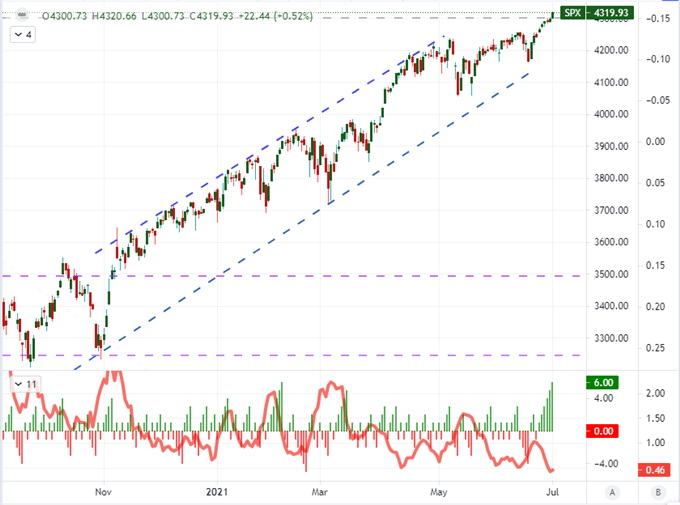
Chart Created on Tradingview Platform
It is easy to confound a particular risk measure like US indices for a broader view of risk appetite. I believe a truer reading of sentiment is a broad look across assets that have a connection to sentiment yet otherwise hold low correlation. There is a mixed view of global indices (there is a head-and-shoulders pattern on the Australian ASX 200), junk bond ETFs finally slipped this past session, crude oil is pressuring a multi-year high and yen crosses have actually firmed. A highlight outside the normal equity sphere I use as a ‘one look’ reference is USDZAR. This Dollar – South African Rand exchange rate is threatening a fairly remarkable technical break. I believe it to be just as beholden to market depth as anything else, but a break back into a larger range is more practical than attempting to extend an already-record stretch.
Chart of USDZAR with 200-Day Moving Average (Daily)
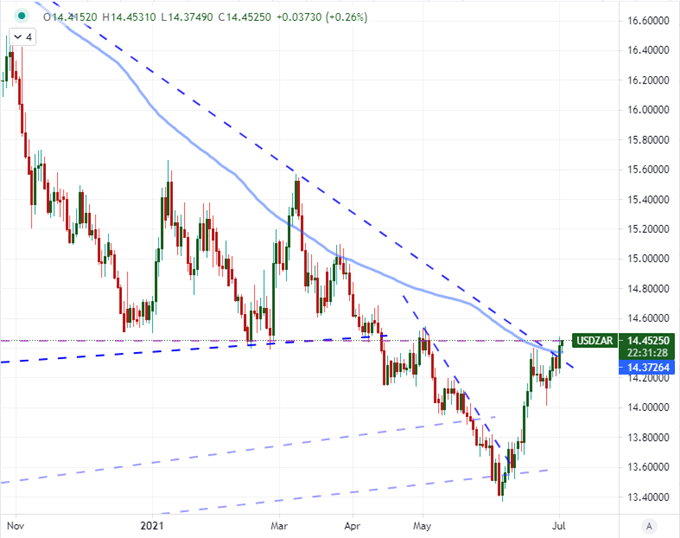
Chart Created on Tradingview Platform
Data Stirs Fed Rate Expectations and, In Turn, The Dollar
While the momentum drift for US indices is a familiar site, the climb from the US Dollar is an unusual site over the past few months. Nevertheless, the trade-weighted DXY Index advanced a seventh straight session through Thursday’s close to secure the longest stretch since February 2019. On a technical basis, that doesn’t move us into uncharted territory for the Greenback itself, but it has pushed some crosses into an uncomfortable make-or-break technical situation. I am dubious that this advance is a drift-style move. Fundamentals have contributed a little heft to the backdrop. Unexpectedly – to me – the Congressional Budget Office (CBO) and International Monetary Fund (IMF) updated their forecasts for the United States. Both increased their GDP forecasts for 2021, to 7.4 and 7 percent respectively. The more impressive update for me was the IMF’s stated expectation that the Fed will start tapering in the first half of 2022 and go for its first rate hike at the end of 2022 or beginning of 2023. That is a hawkish tilt even relative to the FOMC’s own updated forecasts with its last Summary of Economic Projections (on June 16th).
Chart of DXY Dollar Index with 200DMA Overlaid with Implied Fed Rate Hike Through 2022 (Daily)
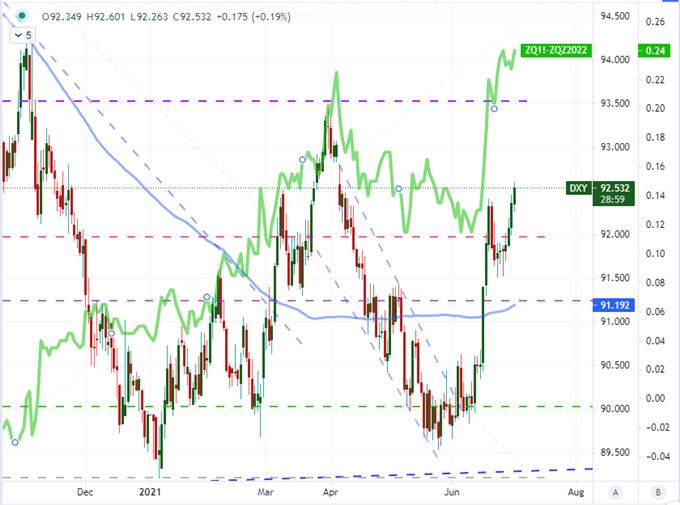
Chart Created on Tradingview Platform
From the docket, this past session was less clear. On the one hand, we had the initial jobless claims which dropped to 364,000 new filings which was the lowest post pandemic reading. The bigger report was the ISM manufacturing survey which fell further than expected. The 60.6 reading could have been read as still-strong economic tempo but a relief for the Fed from the calls that they need to act to head off an overheated economy. That said, component figures didn’t make for a particularly clear register for central bank decision making. The employment component actually slipped into net negative territory (49.9) but the priced paid inflation figure surged to a series high, stretching back to 1979, at 92.1. Given the market’s speculative state, this just increases the need for more information for conviction.
Chart of S&P 500 Overlaid with ISM US Manufacturing Activity (Monthly)
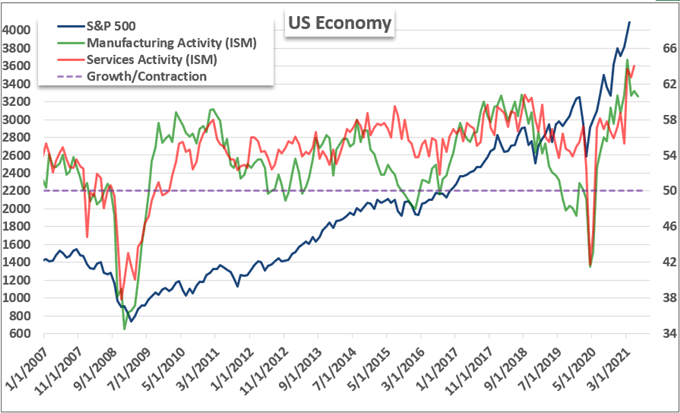
Chart Created by John Kicklighter with Data from ISM
How Committed Is the Dollar Advance with Key Breaks and NFPs Ahead?
While a pair like EURUSD is not traversing any critical technical terrain, there are pairs that are certain pairs that are attempting to gain traction on serious congestion-to-trend developments. It is possible that the market finds certain measures can defy broader convention on restricted volatility, but that is an improbable scenario. That is important for my assessment for what is possible when evaluating chart patterns that seem to cleanly match what you see in technical textbooks. AUDUSD is a great example. It broke a head-and-shoulders neckline a few weeks ago with the 200-day moving average falling along with it. The hold at that former support as new resistance has been somewhat sloppy, but it seems to stand – especially with the projection lower we have seen over the past three-four trading sessions. If the Dollar rally’s post NFPs and can maintain its enthusiasm into next week, this is absolutely a pair to focus on closely.

Chart of the AUDUSD with 200-Day Moving Averages (Daily)
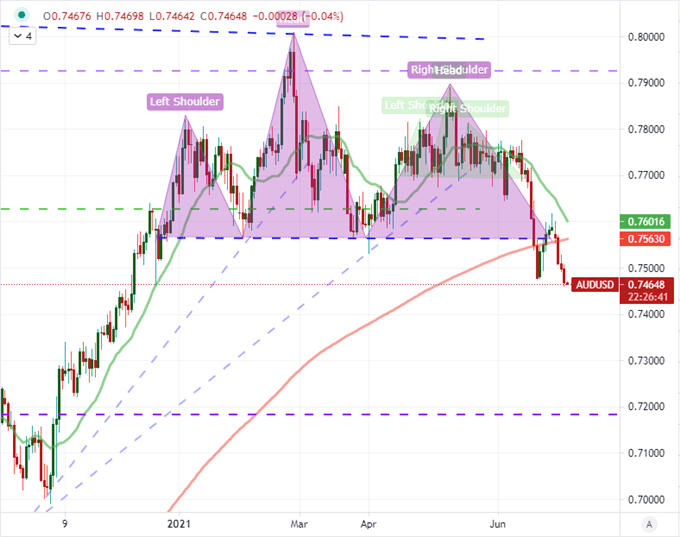
Chart Created on Tradingview Platform
Even if the Dollar manages to foster a deeper bullish run despite the hurdles we are currently deal with, I would still remain skeptical of how productive USDJPY could be with its own bullish break. There is no doubt that we cleared the previous 2021 swing high in late March, but the 111.00 break opens up a dense run of further technical barriers overhead. The past five years has carved out a very large wedge for the pair with many former swing highs not far from our current spot rate. That could readily trip up a market that is not firmly confident of the Dollar’s momentum. And, while a hawkish rate forecast for the Fed can supply lift, I remain a skeptic of the ‘risk on’ that the Yen pairs need to at the very least not stand as an encumbrance.

Chart of the USDJPY with 20 and 200-Day Moving Averages (Daily)
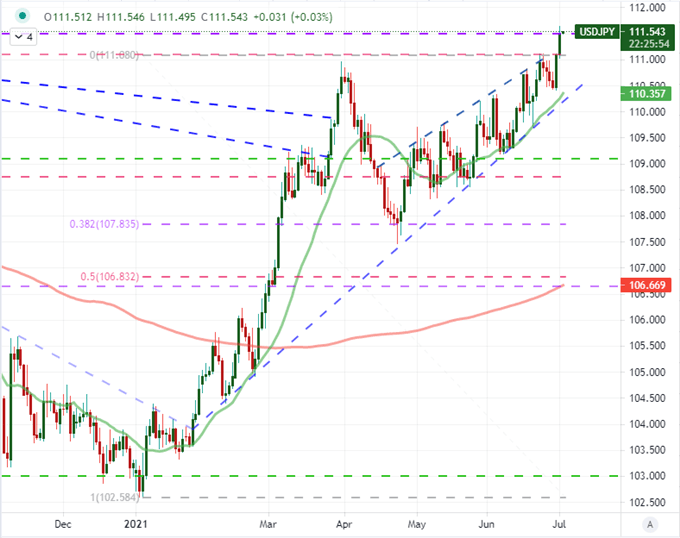
Chart Created on Tradingview Platform
Ultimately, my attention is fixed on what will happen after the weekend – and truly after Monday which will find liquidity curbed by the absence of US exchanges. However, there is capacity for this week’s last major event risk to generate some late-in-the-week heat which could even contribute to the ultimate trend when market depth fills all the way back out next week. The June nonfarm payrolls (NFPs) are instantly recognizable and that is where it draws its true market moving potential. Interpretating the update as a sign for Fed rate speculation is the filter for which the scale of full market movement will arise. The ADP reading from earlier this week beat expectations, but the past two months found the private payroll report sharply overshoot the government’s own figures (they shouldn’t match up). Economist forecasts are looking for a 700 million job increase this past month, but the surprise quotient potential is high.
Chart of NFPs Estimates and Actuals with Difference ‘Surprise’ (Monthly)
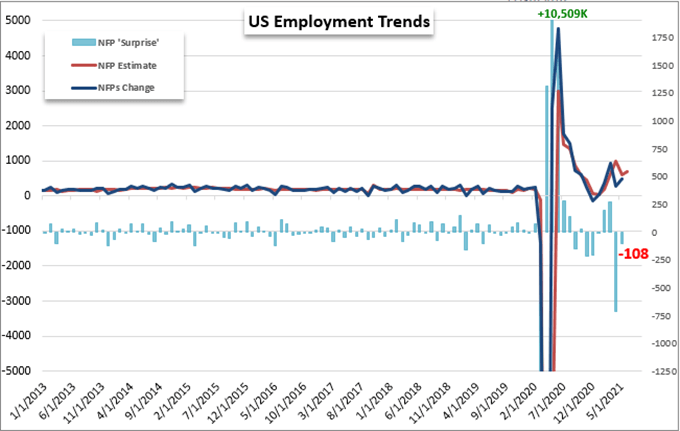
Chart Created by John Kicklighter with Data from ADP

.


