S&P 500, VIX, Dollar and EURUSD Talking Points:
- Though the news of a clean bill of health for banks from the Fed and a possible infrastructure deal leveraged limited speculative charge, the S&P 500 closed at a record
- The Fed’s favorite inflation indicator surged to a three-decade high and Fed Fund futures are pricing in full confidence of a hike next year
- Despite NFPs and confidence figures due for release in the week ahead, market conditions are likely the crux of activity with volume and volatility tumbling
S&P 500 Finishes at a Record High and Risk Appetite Ends On Uneven Ground
Another day and another record high for the S&P 500. Capping off its best week since the period beginning on February 1st, the benchmark stock index closed at a record high this past Friday. These performance milestones have typically proven enough to keep the bullish engine running, but cracks continue to form in the ‘diamond hands’ and ‘buy the dip’ mentality. There are more subtle measures like a slip in the Nasdaq 100 relative to the blue-chip Dow Index that I reference frequently. Then there are the more quantitative such as the Chart of the Day from Bloomberg that reported the smallest percentage of S&P 500 component stocks above their respective 50 day moving averages (46 percent) when the index is pushing record highs since 1999. This is not to suggest that a collapse is imminent. Instead, it speaks to the lack of enthusiasm to buy into a market at record cost. That translates into a slog for a continued ‘risk on’ bearing which dovetails well with seasonal expectations. How to adapt to this environment? Find reliable congestion patterns.


Chart of the S&P 500 with 50 and 100-DMA and 1-Day Historical Range (Daily)
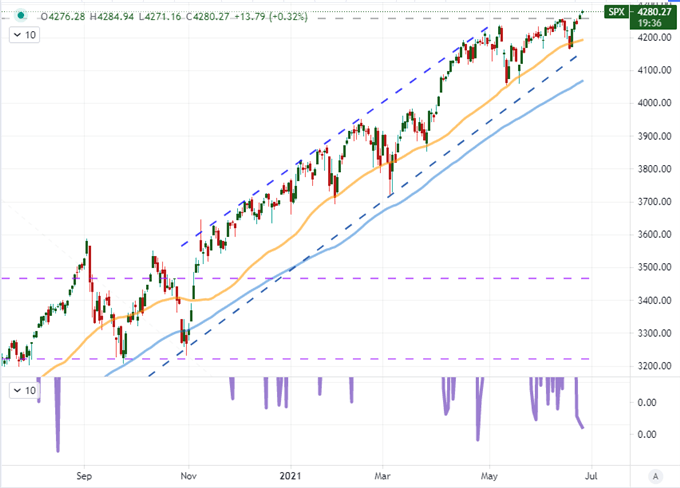
Chart Created on Tradingview Platform
Liquidity Conditions Will Dictate How We Trade
We will transition into the month of July this coming Thursday and the month is historically known for a further slide in volume though VIX does historically show a modest uptick from its record low June in the calendar year (in data going back to 1990). It is fitting that VIX closed Friday at 15.6, which is the lowest daily close since February 2020 (pre-pandemic). Volatility and market activity (measured in S&P 500 volume below) have a strong positive correlation. That is ironic as volatility and risk assets like the S&P 500 have an inverse correlation. In other words, natural relationships in the market will skew conditions such that the market is more likely to crawl higher or collapse lower. As of right now, there is little reason to believe a sharp reversal is on tap, but having options that take advantage of measured conditions and those that benefit a collapse is good planning.
Chart of VIX Volatility Index Overlaid with S&P 500 Volume (Weekly)
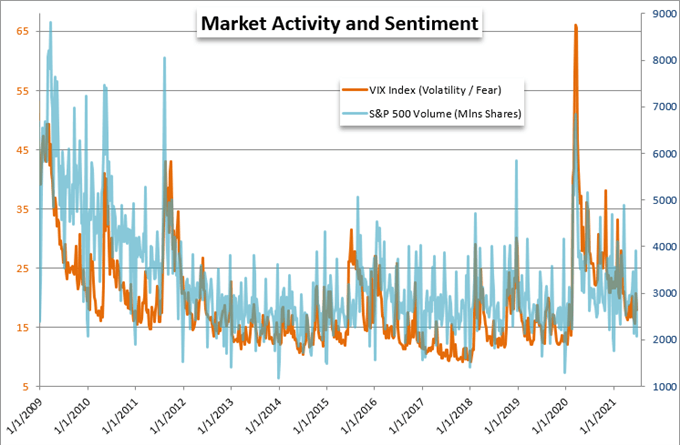
Chart Created by John Kicklighter with Data from Bloomberg Terminal
To illustrate some technical reasoning for holding out a wary view on the market despite the draw of a comfortable seasonal lull, we can take a look at some of the more extreme measures of risk and hedging. The tail risk measure derived from options more than two standard deviations out of the money (the so-called SKEW index) has pushed to a fresh record high this past week. In turn, the put-call ratio which shows the volume of put contracts that make money when markets decline relative to the volume of calls which make money when the markets rise dropped to the lowest weekly read in a decade. That would traditionally be a ‘good’ sign in favor of risk trends, but such extremes raises the perspective of contrarianism.
Chart of the S&P 500 with SKEW Tail Risk Index and Put-Call Ratio (Weekly)
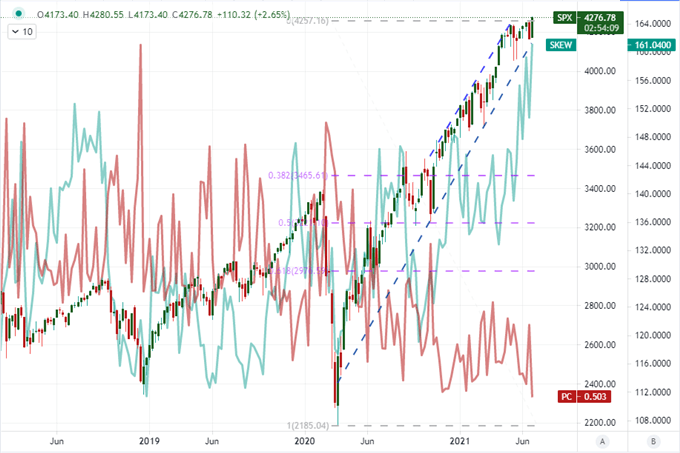
Chart Created on Tradingview Platform
Meanwhile, The Market Expects That Fed Hike
To end this past week, the market absorbed the further surge in the Fed’s favorite inflation indicator (the PCE deflator) that it had expected. At 3.4 percent year-over-year growth, core consumer inflation is running at its hottest clip since 1992 and it has driven American’s purchasing power firmly into negative territory – the cost of goods are more than the increased earnings the populace is seeing. That is the conundrum for the central bank, but there is no reason that the group needs to signal it is accelerating its timetables to normalize extremely accommodative policy in the immediate future. Looking ahead to next week, the only update that explicitly registers on the Fed’s radar for policymaking is the June labor report at the end of the week. The unemployment rate is the official statistic they are supposed to watch, but the net change in jobs is the more sensitive measure and average hourly earnings is the controversial inflation figure. I don’t think this will have a material impact on market bearing largely because it is a Friday release time – if anything, it could work to further curb progress.
Chart of US Core PCE Deflator Year-Over-Year Change (Monthly)
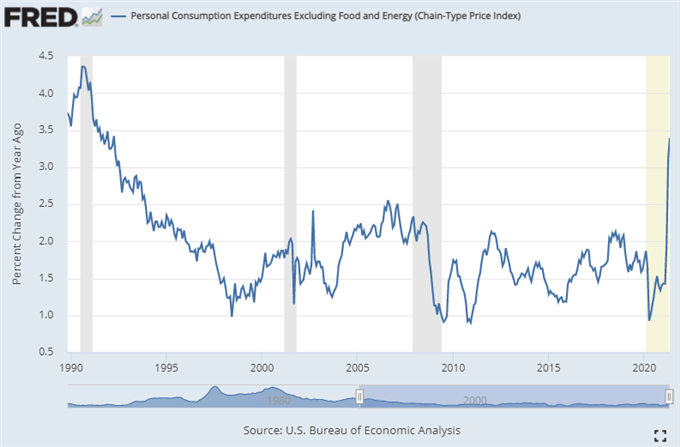
Chart from St Louis Fed Economic Database with Data from the BEA
If US interest rate expectations were to shift materially, that particularly theme would likely be the most capable course corrector for sentiment and the financial system according to the most recent fundamental connections. As it stands, the outlook for interest rates from the market’s perspective measured by Fed Funds futures showed full anticipation of a hike by the end of next year. The difference between the December 2022 and active contracts hit 25 basis points Friday which is the standard hike. This second wind through the end of the week didn’t do much to lift the Dollar further however. The ICE’s DXY Index stumbled through the week, though the 20-day correlation between rate forecast and currency remains very strongly positive. If this catalyst is drying up and the potential for strong risk aversion is diminished, the motivations for meaningful Greenback charge this week look low.
Chart of DXY Overlaid with Implied Fed Hikes Through Dec’22 and 20-Day Correlation (Daily)
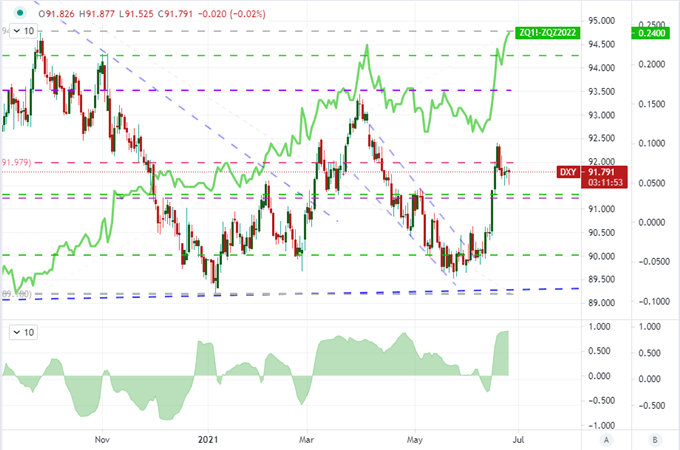
Chart Created on Tradingview Platform
Even if the Dollar isn’t due an overriding trend, there is still plenty of room for short-term volatility. Before the NFPs coming into view, there is the Conference Board’s consumer sentiment survey and the ISM’s manufacturing activity report due Tuesday and Thursday respectively. These can be market-moving with the proper application of surprise. In choosing a counterpart, pairs like GBPUSD and AUDUSD may look appealing for big breaks; but the inherent market conditions are likely to drain momentum before anything substantial occurs technically. EURUSD on the other hand has a wide range that it has traversed these past months, in which it is currently finds itself in the middle. Further there are some worthwhile indicators on the Euro’s side, the peak of which is the Eurozone’s CPI release.


Chart of the EURUSD with 20-Day Moving Average and Spot-MA Disparity Index (Daily)
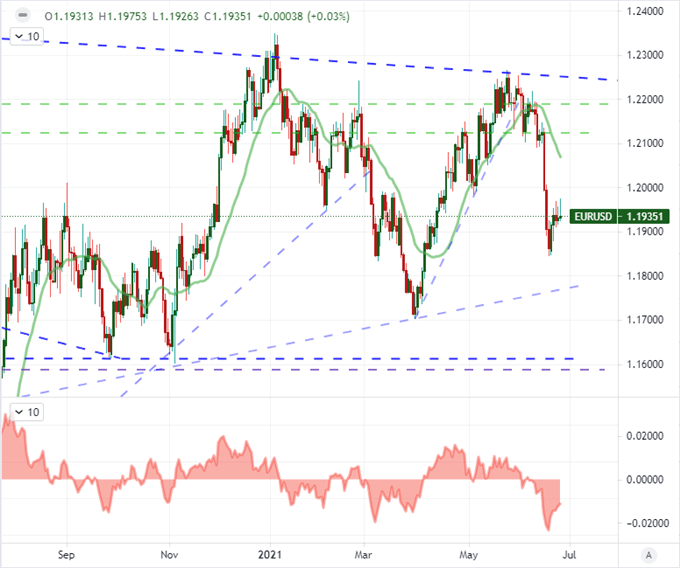
Chart Created on Tradingview Platform

.


