


S&P 500, Dollar, AMC, USDZAR and USDTRY Talking Points:
- While the S&P 500 has firmed up its restrictive trading range – so close to a record high – the AMC has rallied another ~100 percent and carried other meme tickers with it
- In FX, the Dollar has seen another attempt at a bullish breakout falter to leave a prominent upper wick; but ISM services and NFPs are ahead
- Another outlier for volatility in the risk spectrum is the incredible performance from EM currencies with remarkable runs from USDZAR, USDBRL and USDTRY
Speculative Appetite Continues to Press Thinner Markets
Your current perspective on the market could be very different depending on benchmarks you chose to follow or headlines you happened to read. If you happened upon the coverage or price action of certain meme stocks that soared this past session – not unlikely given attention usually hones in on volatility – then you would think that speculative momentum is firmly in place. However, referencing the deeper end of the financial pool, the picture remains one of inertia. The S&P 500 remains the ideal of inconvenient lassitude. Despite being perched just below a fresh record high, the index carved out a narrow range that fits neatly within the previous day’s span and fulfills a trend of moderation in the past two weeks’ recovery effort. A break from this very narrow band is inevitable the further out we go, but I maintain the greatest potential of significant follow through given the general conditions would be a break to the downside (back into an established range). Now, we need to see if event risk ahead or even sentiment itself will urge the market’s resolution.

Chart of the S&P 500 with 20 and 100-Day Moving Averages (Daily)
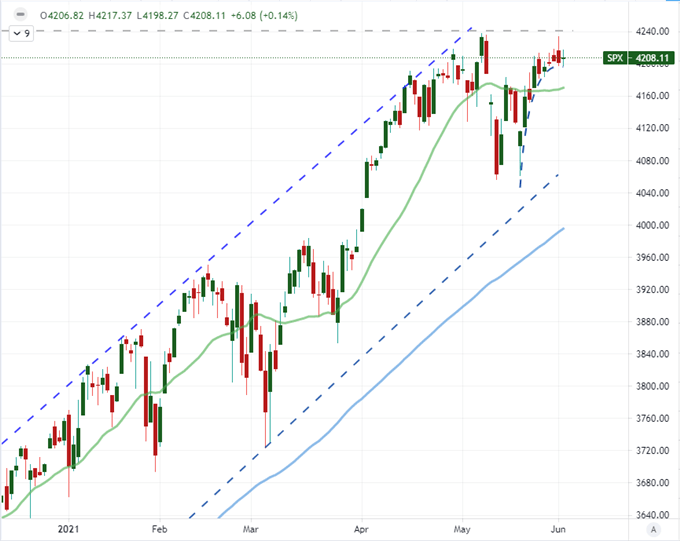
Chart Created on Tradingview Platform
Yet, where the benchmarks are struggling for any sign of conviction, the strong appetite among retail traders looking for momentum – and professionals looking to take advantage of the crowd – is funneling more pressure in the fringe assets that are prized for their momentum and thinner liquidity. While there was some tentative rebound from Dogecoin on news that it would trade on Coinbase, the top focus remained on the meme stocks. In this iteration of the social-inspired run, AMC continues to dominate. After a day of intraday halts and a run up to an intraday high of as much as 127 percent gains, the cinema operator’s share price ended a ‘mere’ 95 percent higher over the previous day’s close. There was news that a hedge fund purchased $230 million in stock from the company, but whatever justification that would reasonably offer to bulls should be utterly undermined by the follow up that they quickly dumped the position for profit. This is a collective speculative move that is spilling over to other names in reddit boards like Blackberry and Bed Bath & Beyond. This rally can extend for an incomprehensible amount of time for many, but a move of this magnitude in an anesthetized market is very likely to end with cascading profit taking on a leveraged positions.
Chart of AMC and 20-Day Mov Avg Disparity Overlaid with BUZZ ETF and Nasdaq 100 (Daily)
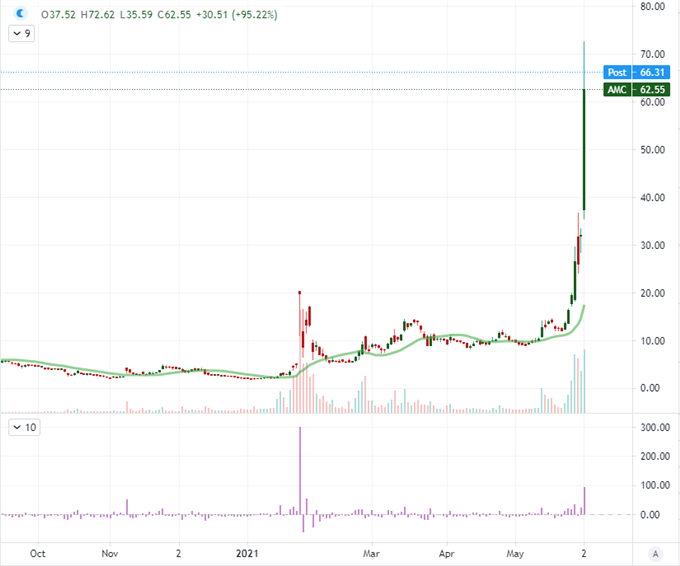
Chart Created on Tradingview Platform
Speaking of the risk in the background of the market, it is easy to dismiss concerns when you have rallies like those from AMC or as the S&P 500 holds steadfast just off its own record. That said, the balance of enthusiasm is always open to scrutiny and concern. The more substantial issue is inspired (perhaps even forced) unwinding of extended positions. What makes that prospect more concerning than usual is the excessive use of leverage across the financial system. ‘Gearing’ works both ways where it amplifies losses as readily as gains. Further, with so many entering markets this late in the move with a leveraged position, the potential for a fast and sticky reversal increases significantly. Beware the leverage.
Chart S&P 500 Overlaid with NYSE Broker Leverage Ratio (Month)
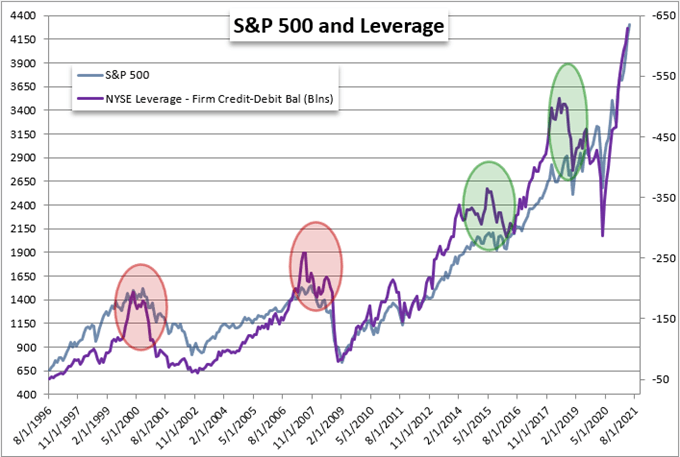
Chart Created by John Kicklighter with Data from NYSE
Active Markets Outside of Meme Stocks
While AMC and a few of its cohorts was the most impressive subsegment in the market thus far this week, there are a few other interesting areas to monitor for volatility and perhaps a little more. One such area of prominence for me is the liquid emerging market FX space. While the EEM ETF and other benchmarks for capital market performance in the developing regions were general quiet this past session, some of the largest currencies in these BRICS and related countries were posting impressive moves. The Brazilian Real mentioned yesterday is still in impressive form with the previous day’s break from a multi-year trendline support driving an extended tumble to 2021 lows. A new highlight heading into Thursday is the South African Rand. USDZAR accelerated a slide to February 2019 lows and may have broken yet another notable trendlines support.
Chart of USDZAR with 100-Day Moving Average (Daily)
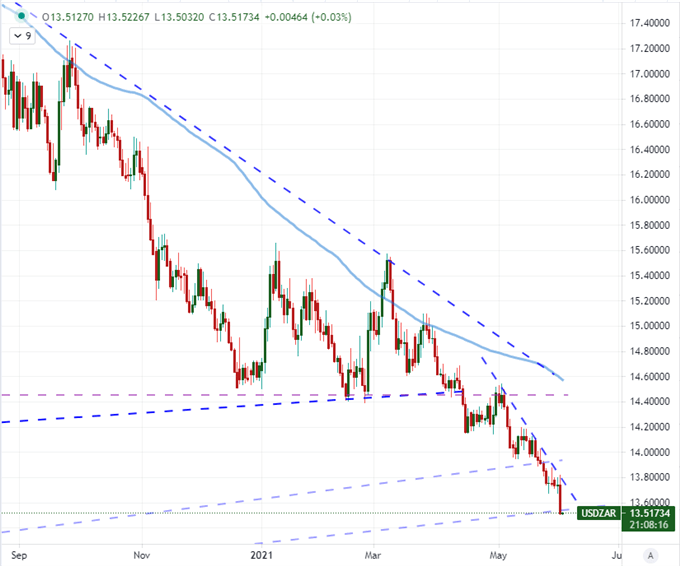
Chart Created on Tradingview Platform
While there are quite a few volatile EM exchange rates, not all of them are in favor of the higher yielding currencies. USDTRY is a great example of the mix in fundamental backdrop that is breaking up a more comprehensive risk demand in this area of the market. Charged by a report that President Erdogan urged the new central bank head to start in on rate cuts, the pair rushed into a new record high as the Turkish Lira toppled lower. There was definite response to the news but the follow through was not absolute. The inevitable policy easing is likely somewhat priced in since the former bank head was replaced back in March, but I don’t think the market fully reflects that future.
Chart of USDTRY with 20 and 50-Day Moving Averages (Daily)
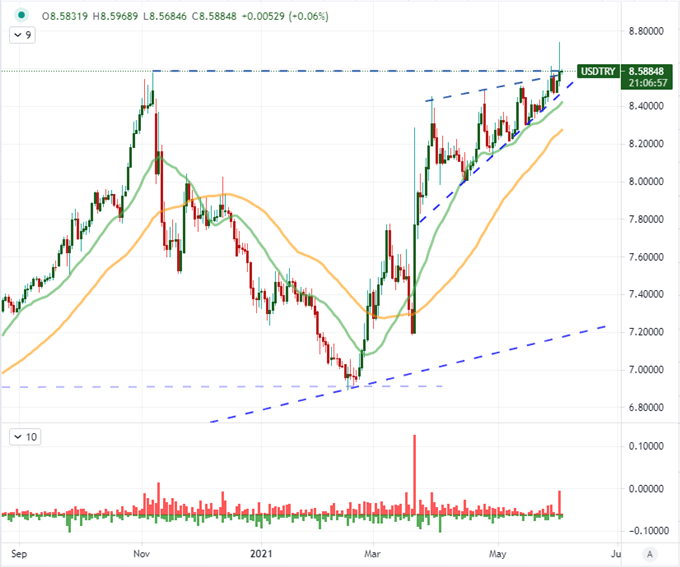
Chart Created on Tradingview Platform
Some Traditional Fundamental Catalysts Ahead
While I am keeping a close watch on the ebb and flow of general risk trends and the retail’s leveraged skew, there remain key fundamental themes that can exact an inordinate amount of influence on the market with the proper application of change or surprise. One such area that remains as point of open concern for investors and observers is the pressure on the Federal Reserve to begin easing back on its abundant support system. This past session, the Biege Book (a two-week countdown until the next rate decision) reported one of the pandemic programs designed to promote stability by purchasing corporate bonds and ETFs would be wound down by the end of the year. A very modest but symbolic effort to taper. The market didn’t seem surprised, so keep an eye on them to see what they do next. Ahead, we have a run of data that is the precursor to Friday’s NFPs: initial jobless claims; ADP private payrolls and the Challenger job cuts numbers. The data point I’m watching more closely is the ISM service sector report. This is the largest component of US growth – and in some measures global growth – so it is an important barometer. That said, we may find the labor and inflation-prone components generate more attention.
Chart of S&P 500 Overlaid with Services and Manufacturing Survey (Monthly)
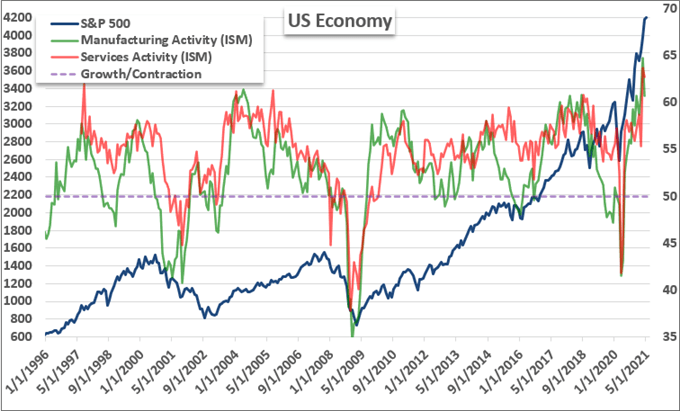
Chart Created by John Kicklighter with Data from ISM
From the ISM service sector report, it can be difficult to read how the market will respond to the outcome. A strong reading from a key growth reading could inspire further risk taking on a backdrop of stable growth or it could spur fear that the Fed has more justification to roll back the safety net. The same uncertainty exists for the US Dollar. Will the data reflect a relative growth benefit or future yield advantage or will a disappointment weigh in the on the opposite. If there is a significant deviation from forecasts this go around like last months, watch closely how the Greenback responds.
Chart of DXY Dollar Index with 20-DMA, Wicks Overlaid Fed Futures Forecast Dec 2022 (Daily)
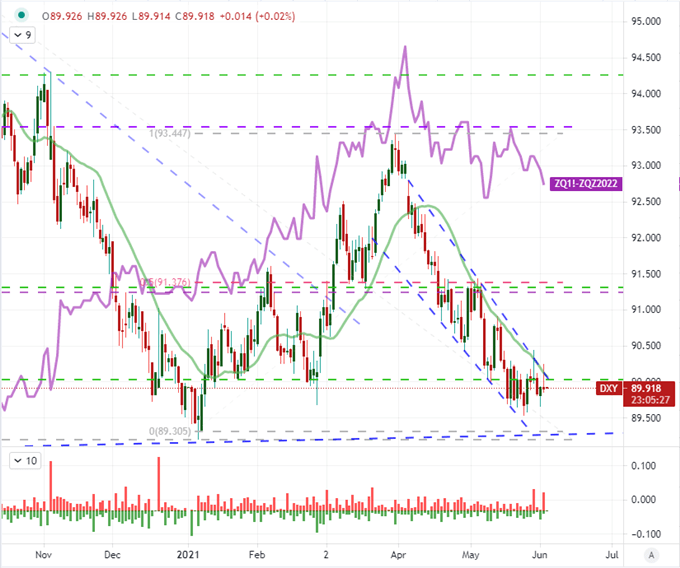
Chart Created on Tradingview Platform

.


