


Nasdaq 100, Dollar, EURUSD, Dogecoin and Ethereum Talking Points:
- The Nasdaq 100 cleared 13,750 support that has held range for the past three trading weeks – leading a move lower in a range of risk assets
- Sentiment seemed to precede fundamentals in the move, but the remarks from Treasury Secretary Yellen on inflation hit a frequent nerve
- Follow through on either risk trends or Fed forecasts would likely find a commensurate Dollar response – but perhaps ISM services will also have a say

Nasdaq 100 Leads a Tumble in Risk Assets as Inflation Chatter Triggers an Overdue Break
It can be easy to confound an abrupt technical move for a charge of deep conviction. What we witnessed this past trading session has elements of – and proponents for – both arguments of a necessary normalizing of exceptionally quiet conditions and the a true break on a fundamental basis. For the latter camp, the mention of the perpetual economic villain, inflation, represented a reminder that the extreme financial reach for risk assets is at least in part dependent on the benevolence of the Federal Reserve and other major central banks. Further, that support will eventually have to come to an end. While the price concerns and interest rate insinuation would come from none other than former Fed Chair and present Treasury Secretary Janet Yellen, I believe the slump this past session still qualifies as a normal and necessary expansion in restricted markets. For the S&P 500 and Dow, we didn’t even really break nearby technical floors. The Nasdaq 100 made the more substantive impression, but even its break falls into a broader range. Risk aversion could continue moving forward, but I believe it requires a stronger wave to carry it to deeper waters.

Chart of Nasdaq 100 with 50 and 100-Day Mov Avg, 6-Day ATR and 16-Day Range (Daily)
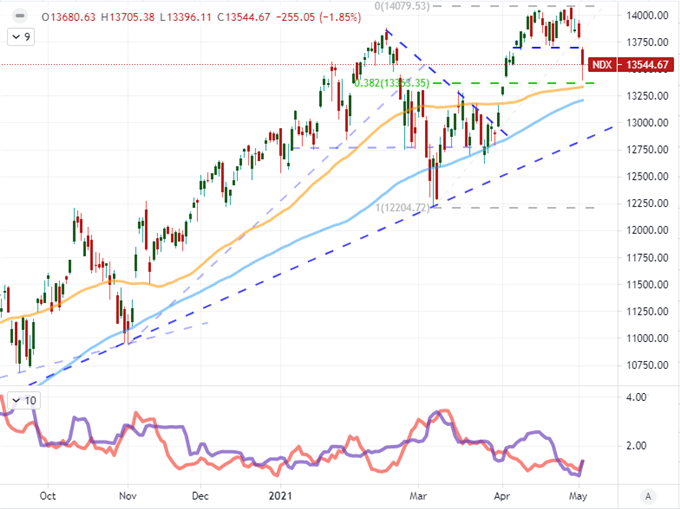
Chart Created on Tradingview Platform
While my short-term view of sentiment is still generally balanced and supportive of a complacent risk-on over the medium-term, the pressure is certainly excessive after months and years of reach. A useful proxy for the concentration of risk appetite is the outperformance of equities over many other major asset classes. That is in part owing to its over-indexed representation in the average portfolio and partially due to persistent moment. Then there are the US indices which reflect the largest economy and some of the heaviest investment via derivatives and other products in the world. Taking it a step further, over the past five years; within US equities, tech has topped the charts – that is until recently. A ratio of the Nasdaq 100 to S&P 500 is something of a leading indicator for sentiment. It is therefore worth looking at the long-term picture of a weekly chart over more than two decades worth of historical price action. Keep tabs on measure’s bearing.
Chart of Nasdaq 100 to S&P 500 Ratio with 20 and 50-Week Moving Averages (Weekly)
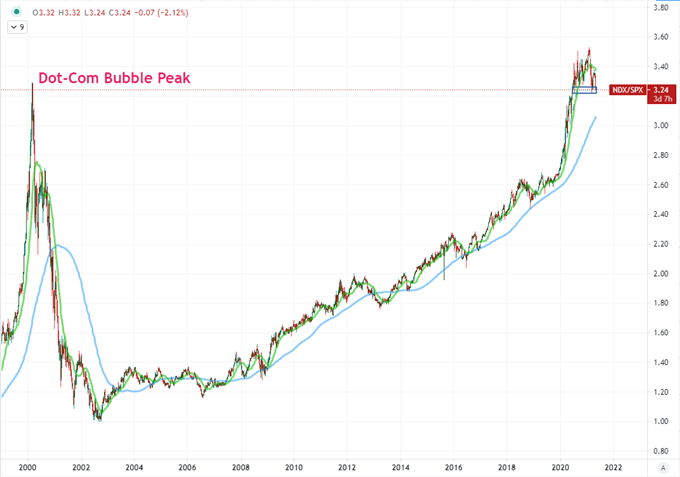
Chart Created on Tradingview Platform
As Inflation Builds, the Advocates for Action Grow Louder and More Numerous
In the past week, we have seen the signs of inflation pressure and concern in the US rise notably. Yet, most of that was preceded by the Federal Reserve’s monetary policy statement and Powell’s press conference which made abundantly clear that they did not intend to stray from its exceptionally accommodative stance. Authorities may find their stance difficult to defend if the headlines keep prompting concerns over charged prices. Adding to the din this past session, Janet Yellen remarked that rates may need to increase in order to prevent the economy from ‘overheating’. Following up on those remarks, the White House Press Secretary said President Biden supports the views that inflation should be taken seriously and rates may need to rise.
Chart of US Inflation via CPI, PCE Deflator and 5-Year Breakeven Inflation Rate (Monthly)
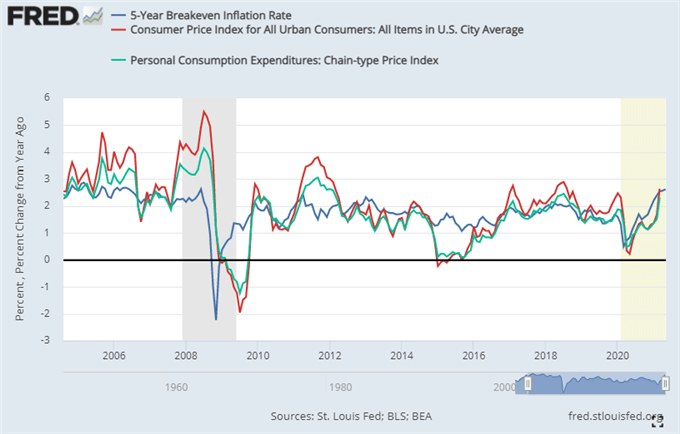
Chart from St. Louis Fed Economic Database with Data from BLS and BEA
The prospect of throttled monetary policy from the United States in the form of eased stimulus and slowly increasing interest rates can have a profound impact on risk trends. That said, there remains considerable skepticism that this is a path that we are already pursuing. As such, traditional benchmarks like the US indices will be reticent to lead the retreat. Emerging Markets on the other hand typically have a greater sensitivity to benchmark rates and the availability of liquidity in the developed world. It is therefore worth noting that the EEM ETF is on the cusp of breaking is long-term rising trend channel.
Chart of EEM Emerging Market ETF with 50 and 100-Day Moving Averages (Daily)
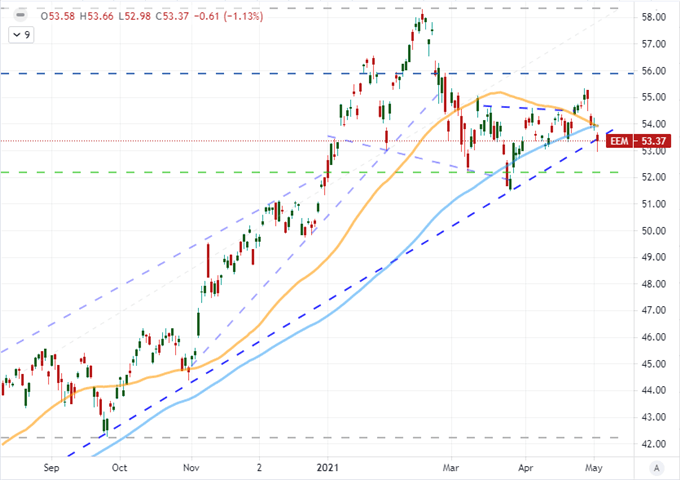
Chart Created on Tradingview Platform
In contrast to emerging markets, however, the US benchmarks that should be particularly tuned to the timbre of local monetary policy didn’t seem to respond as would be expected to the headlines. The US Dollar did recover from Monday’s slide, but that was a move that took traction earlier in the trading day. Despite being at the cusp of immediate resistance (91.35) on the DXY Index at the time of the news crossing the wires, the currency wouldn’t capitalize for a break. Neither did the US 10-year yield nor Fed Funds futures offer the kind of firm bounce one would expect. I’ll be looking here to see how serious the market takes rate speculation.

Chart of DXY Dollar Index Overlaid with US 10-Year Yield and Implied Fed Rates (Daily)
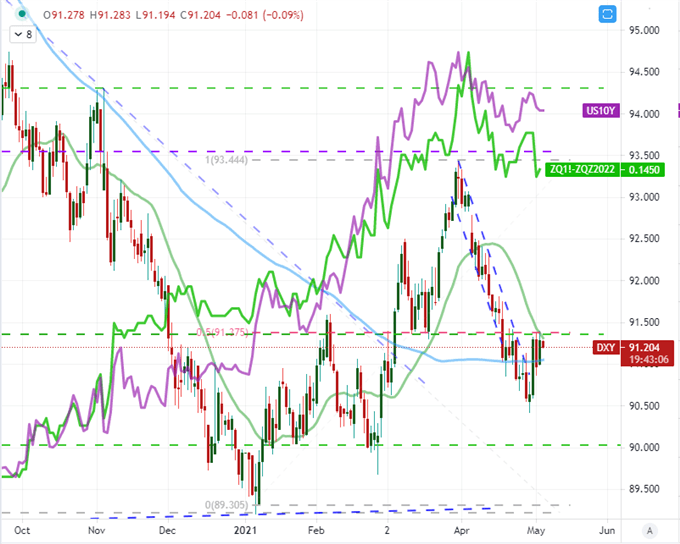
Chart Created on Tradingview Platform
What Ahead: Data and ‘Feelings’
To generate serious traction in these markets plagued by liquidity thinned by seasonal and structural issues, a serious fundamental banner is necessary to rally the troops. This can come from a collective sentiment or it can be spurred by a meaningful data point / event. On tap for Wednesday, the most prominent event on my calendar is the US service sector activity report from ISM. Last month’s reading posted a record high for this sector that represents the largest component of economic output and largest source of employment in the United States. Yet, after Monday’s unexpected correction in the manufacturing component, room for concern has grown. Pulling back from a record high isn’t exactly sign of a crisis, but it does call out overly ambitious optimism in markets founded on this reasoning. Note this data and further consider the implications of a beat or miss on the Greenback.
Chart of S&P 500 Overlaid with Manufacturing and Service Sector ISM Activity Reports (Monthly)
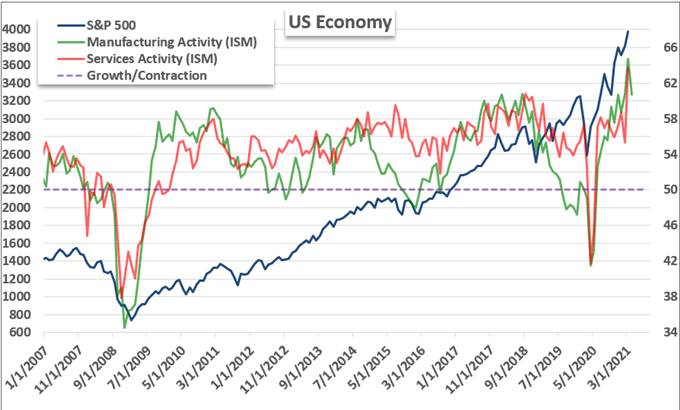
Created by John Kicklighter with Data from ISM
From the discreet to the more abstract, sheer risk appetite and the drive for momentum should be a factor in market observers’ assessments. While the Nasdaq 100 may have eased back, the current leaders of speculative appetite have not fully conformed. Most notably, Dogecoin is extended its incredible charge into Asian session trade Wednesday. This charge relative to the pullback in Ethereum this past session reflects another nuanced appetite where momentum is the top priority. That further tracks down to Ethereum relative to Bitcoin which is trailing even further behind. The motivation is not a meme crypto coming into the mainstream but more likely a shifting preference for where gains are yet uninterrupted. What happens when the hype drive cools?
Chart of Dogecoin with 3-Day ROC and ATR Overlaid with ETH/BTC (Daily)
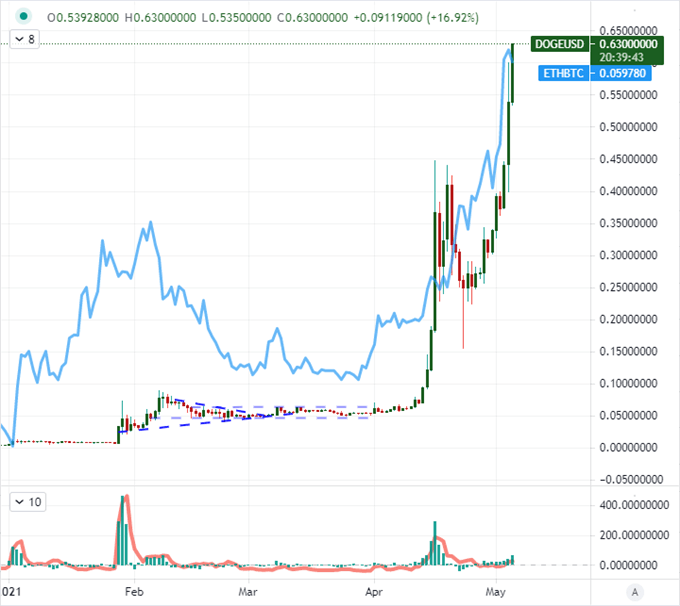
Chart Created on Tradingview Platform

.


