


Nasdaq 100, Treasury Yields, Gold, EURUSD and USDCNH Talking Points:
- Risk appetite slipped further this past session with the S&P 500 sitting on the threshold of a breakdown while the Nasdaq is below its own H&S neckline
- Fundamentally, yields are again a point of interest with US and European 10-year measures rising with gold offering a greater response than EURUSD
- Outside the ‘taper tantrum’ fears, retail excess and general growth expectations are contrasting themes battling for market influence

A General Slump and a Solo Break Raise Speculation of ‘Risk Off’
When it comes to fundamentals, one of the most important considerations for market impact in my book is whether the motivation is systemic. Shifts in speculative perspective that cross regions and assets tend to foster more productive trends rather than sharp moves in particular corners of the markets. And, when it comes to the most recognizable and persistent driver in the financial system, sheer risk appetite tends to usher the years-long advances as well as the abrupt collapses into bear markets. Just off record highs on the major US indices and following a few weeks of congestion despite ever-growing exposure, concern is likely growing that an earnest reversal could arise. That makes sense against the rise in Google search around “market bubble” and “taper tantrum”. And yet, I prefer to have tangible progress to make such an important call. The Nasdaq 100 took a step in the right direction this past session closing below the neckline on a fairly prominent head-and-shoulders pattern stationed around 12,800. That said, I’d like to the other major indices (S&P 500, Dow, Russell 2000) follow with their own critical breaks along with a broader variety of risk assets.
Chart of Nasdaq 100 with 50 and 100-Day Mov Avg and 1-Day ROC (Daily)
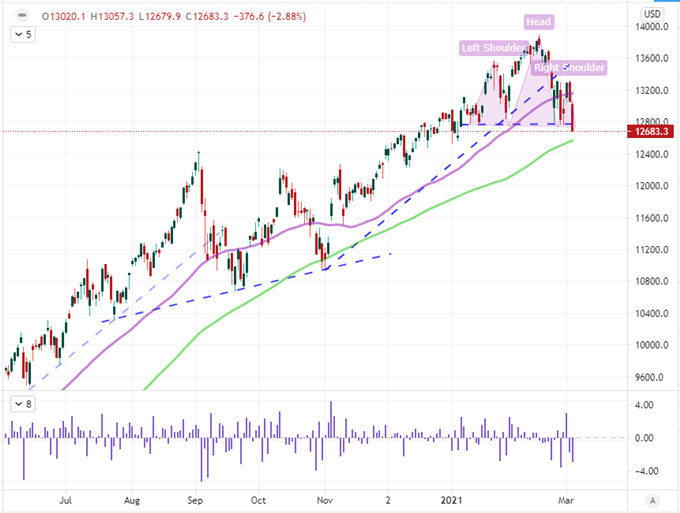
Chart Created on Tradingview Platform
Though it has lost some of its clout these past months as other retail interest shave latched on to other trends, the US tech sector is still one of the top performing categories of the market standards through the past years. That said, the ratio of the Nasdaq 100 to the S&P 500 tumbled this past session to its lowest since November 18th. Further out on the limb of extreme trades: SPACs have lost some altitude (via SPCX), Dogecoin and other alt darlings of previous weeks are trading water and WallStreetBets Reddit board favorites are struggling. The 71 percent Tuesday rally from Rocket Companies (RKT), today’s top mention in the WSB board, was hit with a 31 percent retreat this past session. How many isolated efforts to spur sentiment will fall apart before markets seriously question the complacent hold on risky exposure?
Chart of RKT Rocket Companies with 50 and 100-Day Moving Avgs and 1-Day ROC (Daily)
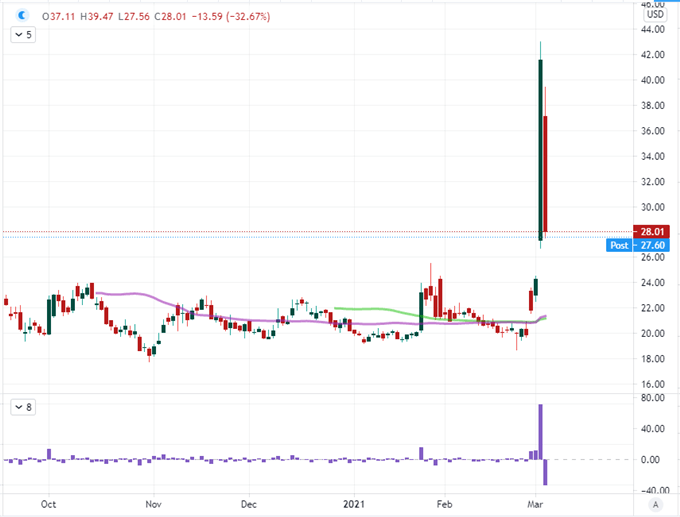
Chart Created on Tradingview Platform
While I am closely watching the hairline cracks that are starting to run through the speculative core of the market, it is important to remember the prevailing trend. The S&P 500 is still more than 73 percent higher than the March 23rd, post-pandemic swing low. Furthermore, interest in “day trading” and “penny stocks” has pushed to the highest search in Google’s historical data. Retail investment brokers like Fidelity (who reported a 17 percent increase in retail accounts in 2020) are reporting self-directed traders are crowding into the market. Even amid the SPAC (Special Purpose Acquisition Company – a means to fast track IPO) boom, it was reported this past session that a new ETF was being created to track favorably mentioned companies over $5 billion in market cap via social media. There is extraordinary attention and exposure from a group that has a very short expected holding period and more limited investing acumen.
Chart of Global Google Search for ‘Penny Stocks’ and ‘Day Trading’ (Weekly)
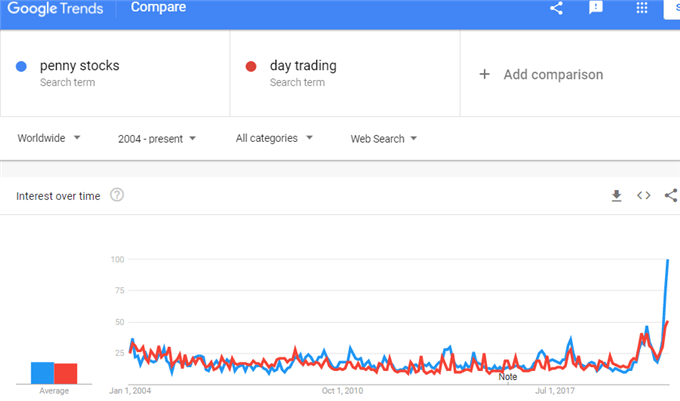
Chart Created by John Kicklighter with Data from Google Trends
Yields are Rising Once Gain as Growth Concerns Show Up on the Edges of the Radar
Ultimately, sentiment is perfectly capable of charging a self-sustained trend; but catalysts often play a critical role in igniting the fire. The rise in government bond yields across the globe is once again making waves with a resurgence this past session particularly in US, German and UK 10-year bond yields. The concern here is multi-faceted. A charge in yields without the commensurate enthusiasm of exceptional growth suggests inflation risks that will erode rates of return that are already bare bones. That would in turn insinuate that the Fed may be forced to hike rates – concern for which you can see in Fed Funds futures (the implied increase through end of next year is below in green). It also raises the specter of ‘what happens if the central banks lose the market’s confidence for maintaining stability?’
Chart of US 10-Year Yield with Fed Fund Futures Yield Projection to Dec 2022 (Daily)
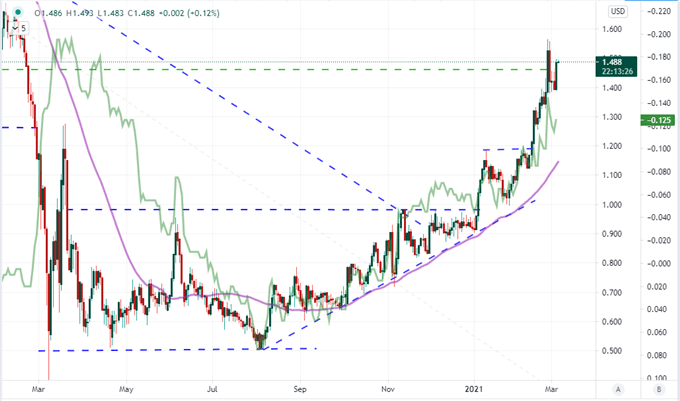
Chart Created on Tradingview Platform
On the point of yields, EURUSD offered an important read this past session. The Fed Beige book offered up a favorable wind for recovery forecasts but the Fed’s Brainard remarked the other day that they were monitoring yields closely. We will see if Chairman Jerome Powell has anything to say directly on the matter tomorrow in his speech at 15:00 GMT. Meanwhile, the more hawkish ECB member Jens Weidmann said altering pandemic stimulus was possible amid rising yields and Luis de Guindos would also say options are available – though he tried to curb ‘yield curve control’ speculation. Will this be the spark that finally pushes EURUSD out of the 1.2200 – 1.2000 range?
| Change in | Longs | Shorts | OI |
| Daily | 1% | -1% | 0% |
| Weekly | 15% | -13% | -1% |
Chart of EURUSD with 50 and 100-Day Moving Average (Daily)
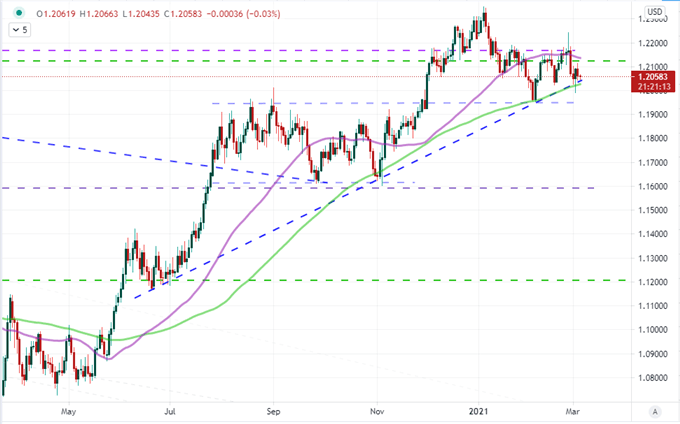
Chart Created on Tradingview Platform
One market that seems to be feeling the crunch of rising yields here and now is gold. The precious metal that tends to outperform when yields are extremely low and falling has suffered amid this rebound. While there is still some safe haven potential from this commodity should things get dicey moving forward, it is more likely that the market seeks out a range of alternative harbors from any storms should it move in .
| Change in | Longs | Shorts | OI |
| Daily | 1% | -3% | -1% |
| Weekly | 2% | -8% | -2% |
Chart of Gold Overlaid with Inverted Aggregate 10-Year Yield Gov’t Bond Yield (Daily)
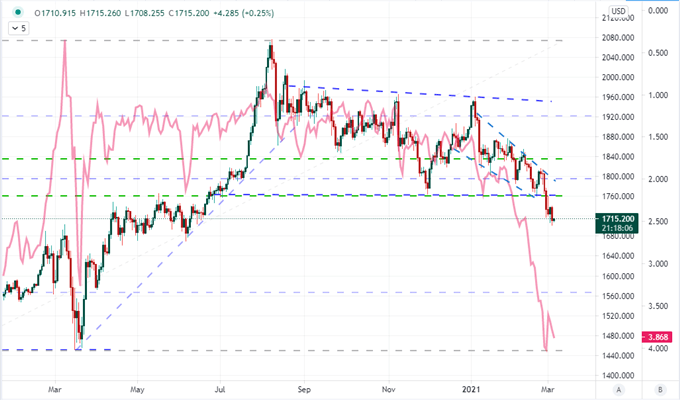
Chart Created on Tradingview Platform
Meanwhile, growth has installed itself as a building potential impetus for risk trends and perhaps even for some alterations in the perceptions of relative value. This past session, in addition to the Beige Book update, the ADP employment report for February (a lead in to Friday NFPs) disappointed with a 117,000 net increase while the ISM’s service sector activity report faltered 3.4 points to 55.3. That is a distinctly US overview, but we were also taking in the Australian 4Q GDP update (3.1 versus 2.5 percent growth expected) and the UK’s OBR economic forecast 4 percent growth in 2021 (a cut from the 5.5 percent outlook offered up in November).
Chart of S&P 500 with ISM Manufacturing and Services Activity (Monthly)
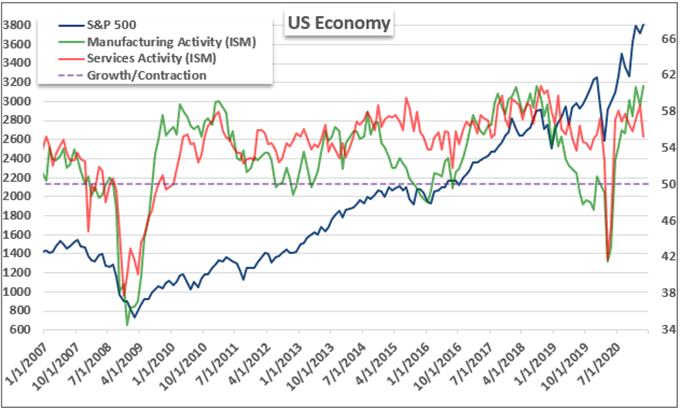
Chart Made by John Kicklighter with Data from ISM
One bonus area to keep an eye on as it often falls out of the normal tides of market-derived sentiment trends, USDCNH has worked to establish a base through all of 2021 thus far. With a range high of 6.5000, there seems a very clear technical threshold that both retail traders and policy officials will likely focus in on. With the National People’s Congress Two Sessions starting today, an eye should be kept out for surprises – especially as they would be considered intentional if they hit the wires.
Chart of USDCNH with 50 and 100-Day Moving Averages (Daily)
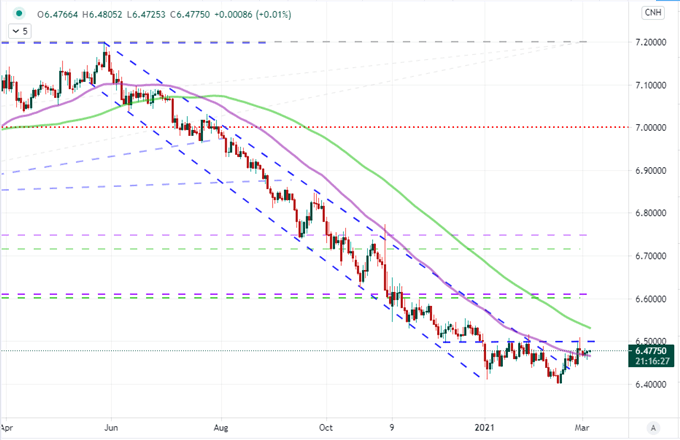
Chart Created on Tradingview Platform

.


