S&P 500, Nasdaq, Treasury Yields, EURUSD and Bitcoin Talking Points:
- The new week has started with a material risk aversion as both the S&P 500 and Nasdaq 100 stumbled – though fear is not yet universal
- Last week’s surge in 10-year yields has further raised concerns among global investors of inflation and risk to their capital exposure, a fear Lagarde attempted to address
- Top event risk over the coming session is the start of the two-day semi-annual testimony from Fed Chairman Powell who must dance around ‘taper tantrum’ fears


Risk Trends Threaten a Break but Trends are a Different Story
Markets were under pressure to start the new week – at least risk trends were. With concern over inflation and a withdrawal of the global stimulus safety net gaining traction, the milestones for risk appetite were struggling after the weekend. Setting aside the very popular but thinly traded meme stocks aside for a second, the baseline for sentiment over the past decade – the benchmark S&P 500 – was under pressure through Monday trade. The SPX dropped for its fifth consecutive trading session for the longest series of losses stretching back to the pandemic start almost exactly a year ago. Yet, outside of this technical measure, the progress was otherwise restrained. The benchmark is on the cusp of a technical breakdown with a ‘head-and-shoulders’ pattern in the making, but follow through is not something the financial system seems willing to commit to readily. I will be looking for the S&P 500 to clear 3,875, but my interest in gauging a broader sentiment shift will span far further than this measure alone.
Chart of S&P 500 with 50-Day Mov Avg and Consecutive Candles (Daily)
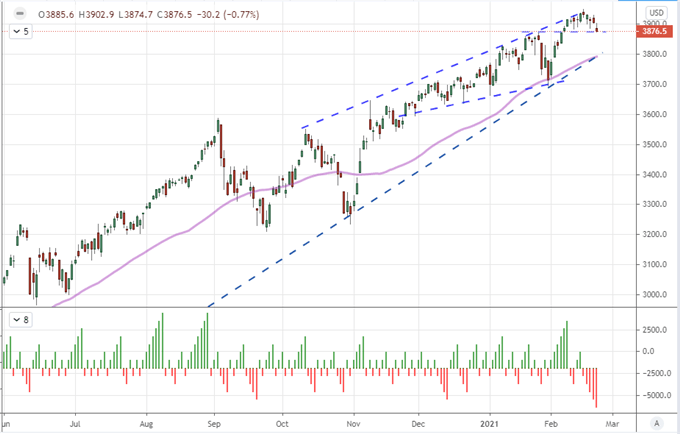
Chart Created on Tradingview Platform
As sentiment starts to wobble, it is worth noting that we have yet to see a full unwinding of speculative appetite. That said, some of the more popular measures of late have come under serious strain. Reddit favorite stocks were treading water while Dogecoin were suffering a crush in volume or outright retreat respectively. The baseline measure that I am most mindful of however are the US tech sector which has enjoyed its climb for years – while truly finding its stride in the recovery post-pandemic. That said, the Nasdaq 100 took a notably severe hit through the opening session of this week. In fact, when we consider the -2.6 percent from NDX relative to broader indices, we get a sense of the fundamental hit. The ratio of the Nasdaq 100 to the Dow Industrial Average shows a particular acute drop for ‘growth’ relative to ‘value’.
Chart of Nasdaq 100 to Dow 30 Ratio Overlaid with Dow and 1-Day Rate of Change (Daily)
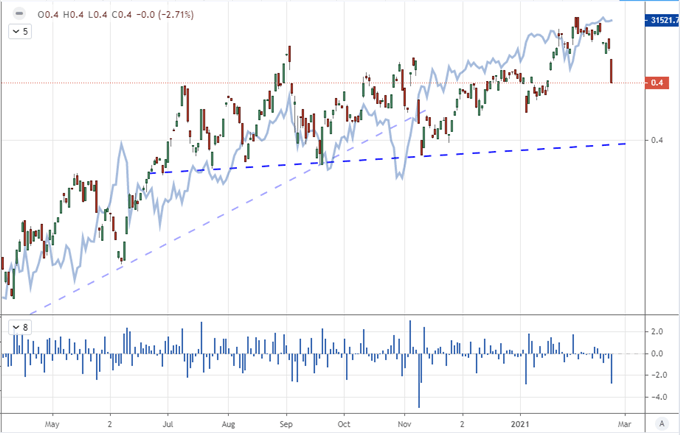
Chart Created on Tradingview Platform
With the power dynamic of inexperienced retail traders under consideration by both social circles and Congress, it is worth noting that the top mentions in the WallStreetBets Reddit board were either suffering very low volume (a fate almost akin to irrelevancy) or they entered the realm of standards like the S&P 500 SPY ETF, Tesla and Apple. It seems this fad may already have passed – though its fallout from regulatory scrutiny has not – but I wouldn’t simple right off this segment of the market completely. In a market fueled by complacency, errant risk taking can crop up with little warning.
Read about how the rise retail can be a signal for a market mania.
Chart of Top WallStreetBets Reddit Board Mentions (Minute)
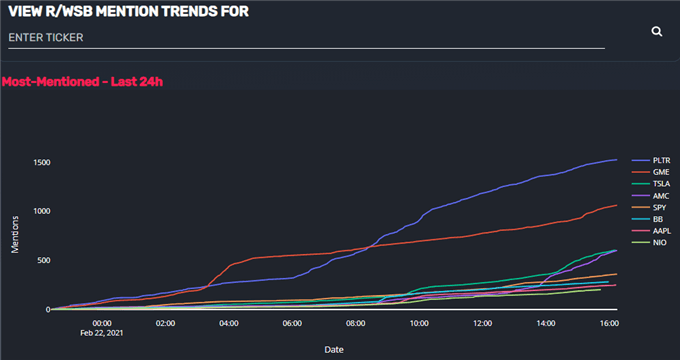
Chart from Quiver Quantitative
Retail Control Fades as Market Concern Over a Taper Gains Traction
Looking for a motivation for risk trends a little deeper than mentions in social outlets, the sheer scale of activity among the inexperienced should keep market participants on guard. The Google search ranking global for ‘day trading’ is still pushing fresh record highs as the unusual post-pandemic appetite for income outside traditional employment builds off of the extreme support offered by stimulus. Such a dependency on the capital safety net though seems to have roused unwanted interest in the eventuality of the so-called ‘taper tantrum’. It is very likely a long time until the actual roll off of stimulus for the Fed is to begin but markets are forward looking in this regard and the broad rise in 10 year government bond yields is not going unnoticed.
Chart of Global Google Search for ‘Day Trading’ and ‘Taper Tantrum’ (Weekly)
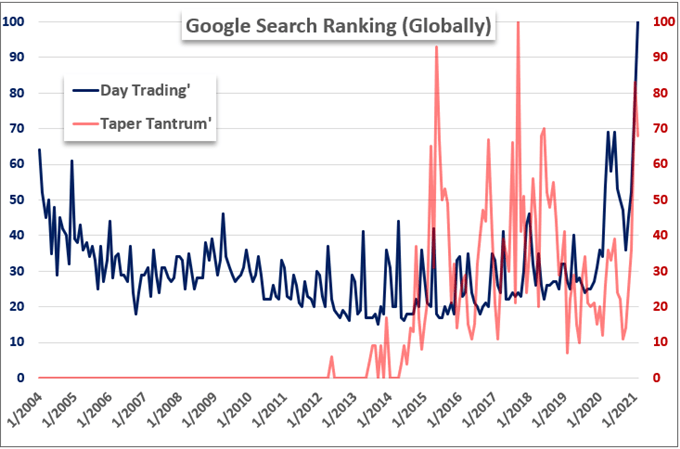
Chart Created by John Kicklighter with Data from Google Trends
The US 10-year Treasury Yield has overtaken the 1.35 percent mark for the first time in almost exactly a year. I would chalk that up to exceptional growth forecasts for the United States. That matter is easy to cross check considering that the same duration of sovereign debt is showing strong gains in the UK, Germany, Japan, Australia and other areas of the world. In other words, there is a global concern afoot which may be the recognition of inflation risks and the subsequent slide in value that comes with financial assets.
Chart of US 5-Year Breakeven Inflation Rate and Dollar Index (Monthly)
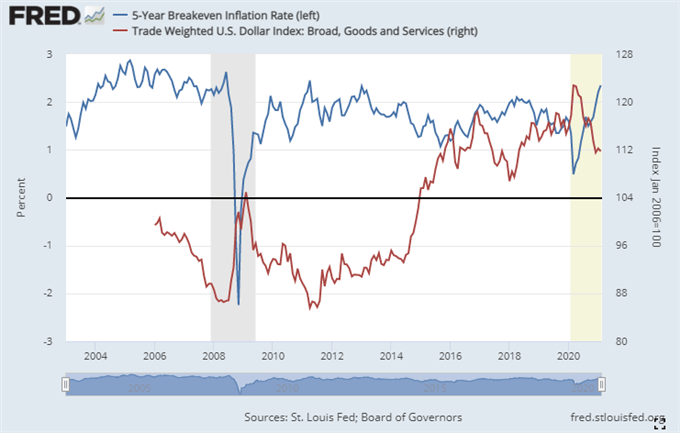
Chart Created on St Louis Federal Economic Database
Big Movers from the Dollar to Bitcoin to Commodities
One area where the stimulus-disrupted market performance was picking up a reading was via EURUSD. The pair itself was sporting a third consecutive session’s rally that would again put the range high between 1.2180 and 1.2150 in jeopardy. Yet, I wouldn’t put too much weight into a technical break from even so prominent a liquid asset as this top exchange rate. Follow through remains a missing ingredient for the entire financial market even as volatility rears its head. I will note this past session however that ECB President Lagarde remarked that they were monitoring rising bond yields to rouse a passive threat the group has made on and off over these past years. That sets up top event risk for Tuesday and Wednesday in Fed Chairman Jerome Powell’s semi-annual testimony before Congress. Will he be able to soothe fears over a withdrawal of global stimulus which has become a critical support structure or will the market interpret that future in his remarks?
| Change in | Longs | Shorts | OI |
| Daily | -1% | -4% | -3% |
| Weekly | 4% | -10% | -5% |
Chart of EURUSD with 30-Day Historical Range Percentage of Spot (Daily)
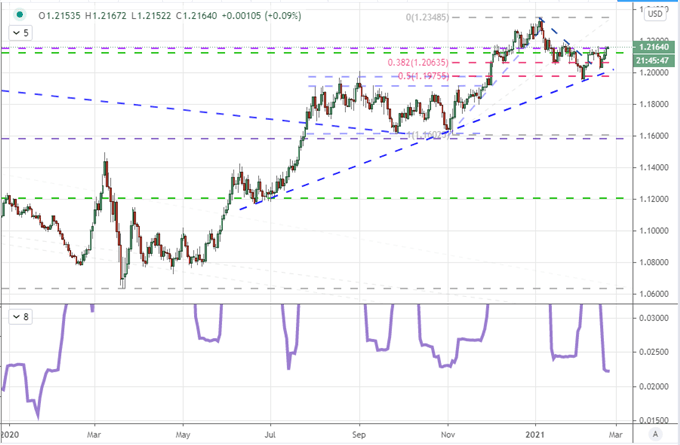
Chart Created on Tradingview Platform
My principal attention on the fundamental side over the coming few days will remain with the US indices and the Dollar-based majors, but that isn’t the only corner of the market worth watching. Commodities is a particular venue that deserves its own watch list line. Physical assets continued their climb this past session with crude oil retaking 62 and gold posting a recovery from its battered position these past weeks. Most impressive to me though was copper however. The growth-anchored metal extended its run to push the best 10-day climb since November 2016 as it pushes general highs not seen since August 2011.
Chart of Copper Continuous Futures Contract and 10-Day Rate of Change (Daily)
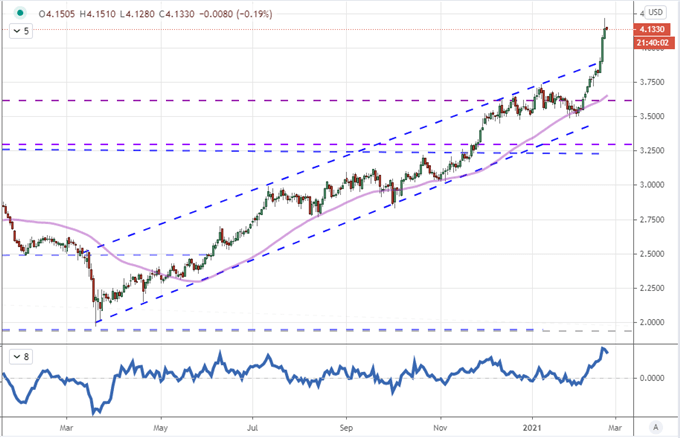
Chart Created on Tradingview Platform
While watching the ‘core’ of speculative appetite, I am of course also monitoring the leading edge risk appetite. Given the crush in meme stocks, that would leave the more persistent cryptocurrency space as a milestone for market participants. That said, Bitcoin’s tumble Monday was hard to miss. While the top cryptocurrency was well off its intraday lows – cementing its biggest ‘lower wick’ on its record – the was still seriously struggling. Tesla’s Elon Musk mulled publicly whether it was too high on Saturday while Treasury Secretary Janet Yellen again remarked on its shortfalls (used for illicit transactions and ‘extremely inefficient’) but I think these are less influential than its attachment to general risk trends.
Chart of Bitcoin’s BTCUSD with Size of ‘Wicks’ (Daily)
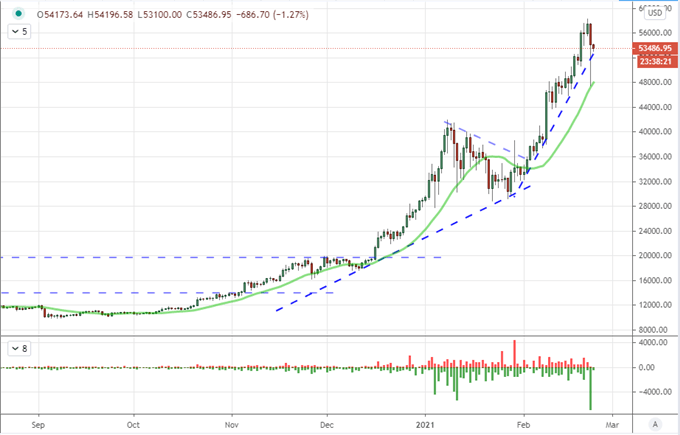
Chart Created on Tradingview Platform


.


