


S&P 500, Tilray, Tesla, EURUSD and GBPUSD Talking Points:
- While benchmarks for risk trends like the S&P 500 are hovering at record highs, the lack of progress is urging more extreme risk taking
- Amid the questionable confidence, swells in thinner markets like Dogecoin, GameStop and more recently Tilray and other pot stocks occur
- Looking back to more structural fundamental motivation, GBPUSD is Friday’s top motivation for volatility between UK GDP and US confidence updates

How a Core of Indulgent Risk Appetite Encourages Extreme Speculation
There remains an undercurrent of risk appetite across the global markets, though benchmarks like the S&P 500 and Nasdaq 100 have leveled out this week. Yet, a pause in the rampant acceleration hasn’t yielded much in the way of a speculative breather considering the measures hold at record highs. And, it may be these anchors to extraordinary heights which is urging the reckless rallies in otherwise unusual corners of the financial system like the heavily shorted stocks (eg GameStop), alt-coins like Dogecoin and this week’s fascination in cannabis stocks. Complacency is a familiar backdrop for speculators over the past decade with top risk measures refusing to relent to fundamental concerns. So long as this backdrop of premium remains, the flare ups of indulgent manias will likely continue. Heading into Friday, the possibility of short-term retreat is a possibility but lower probability. Nevertheless, the four-day range from the S&P 500 – as a percentage of spot – shows the starkest quiet for the measure since December 31st (holiday inactivity) and before that the August 18th summer doldrums until stretching back to pre-pandemic conditions in mid-February 2020.
Chart of S&P 500 ETF SPY with Volume, 50-Day Mov Avg and 4-Day Range (Daily)
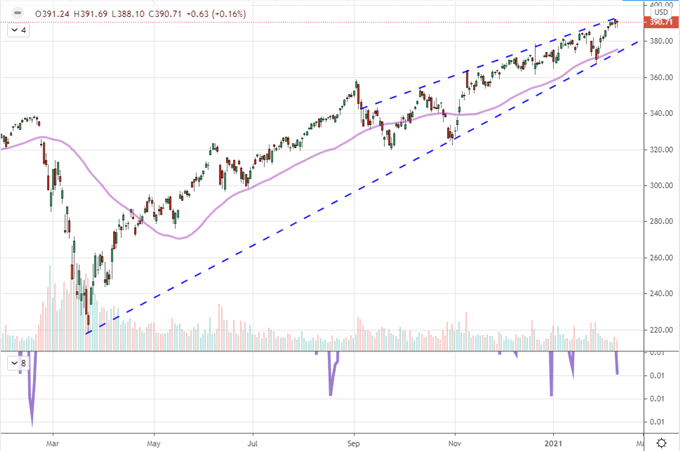
Chart Created on Tradingview Platform
As we await a stronger undercurrent from the financial system, I – like so many others – will continue to follow the extreme moves driven by the frenzied retail groups like the WallStreetBets board on Reddit. The most recent focus of their attention, cannabis stocks, has already started its unwind. The most mentioned ticker in the r/WallSteetBets was Sundial (SNDL) which surged 79 percent Wednesday and dropped -19 percent (from close to close) on 2.96 billion shares traded this past session. That said, the mainstream seems to be more interested in the likes of Tilray (TLRY) and Aphria (APHA) with -50 percent and -36 percent tumbles respectively Thursday. With such extraordinary movement and the human need to rationalize the unknown and irrational, these two present a pretense of fundamental justification in the charge with talk of merger and general decriminalization. Yet, the practical gearing to such extraordinary moves is the targeted interest of a feverish crowd and a market that is not liquid enough to handle the influx. With Tilray sporting volume around 200 million shares on an available float of approximately 95 million, amplitude can be extreme. So what will be the next target? It is unlikely to be a bigger mover that could sway the entire financial system and the ability to pull the entire market through a much smaller outlet is quickly fading.
Read about how the rise retail can be a signal for a market mania.
Chart of Tilray Overlaid with Aphria and Volume, 1-Day Rate of Change (Daily)
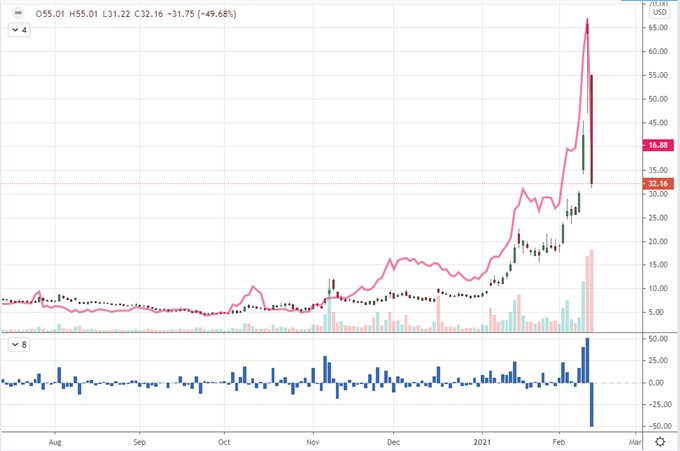
Chart Created on Tradingview Platform
Where the Fundamentals and Liquidity are a Little More Tangible
While liquidity can work against a hyped market holding onto its gains – particularly those that are smaller in size – it doesn’t necessarily mean that they have to fall apart. Silver which was a brief target in the three trading days through February 1st hasn’t exactly collapsed, though it has lost its short-term excess premium. One market that I have been covering more frequently of late, cryptocurrency, is holding its buoyancy more readily. That may be in part due to the additional interested from institutions’ interest in this relentlessly popular asset. While Dogecoin still carries more of the hallmarks of a speculative indulgence, Bitcoin has more handholds in the realm of fundamentals. This past session, one of its most famous advocates put in further support for the coin. Tesla founder Elon Musk insinuated it was the most omnipotent cryptocurrency with a reference to Lord of the Rings – though his companies $1.5 billion investment in BTC and plans to accept it as payment is really what affords the markets attention to his social media.
Poll Gauging Respondents’ Conviction in the Future of Bitcoin
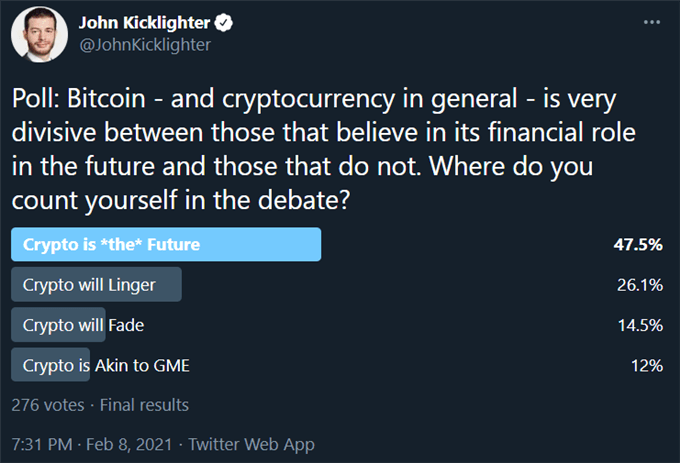
Poll from Twitter.com, @JohnKicklighter
In a more traditional vein, stimulus continues to represent the true structure to the risk appetite we have seen form these past years. US President Biden invited a bipartisan group of senators to the Oval Office Thursday to discuss terms for long overdue infrastructure spending. This builds on the efforts to pass a massive $1.9 trillion Covid relief package which House Speaker Pelosi expects to pass by the end of the month. There are concerns that this scale of an infusion is excessive, but that wouldn’t worry speculative interests in the short-term which are perfectly happy to take advantage of the opportunity so long as it rides. It wouldn’t be much different than the situation with monetary policy excess which has seen the Fed and other major central banks flood the system with cheap funds that naturally allure investors who feel little risk as the system maintains its steadfastness.
Chart of S&P 500 and Aggregate Central Bank Balance Sheets in US Dollars (Monthly)
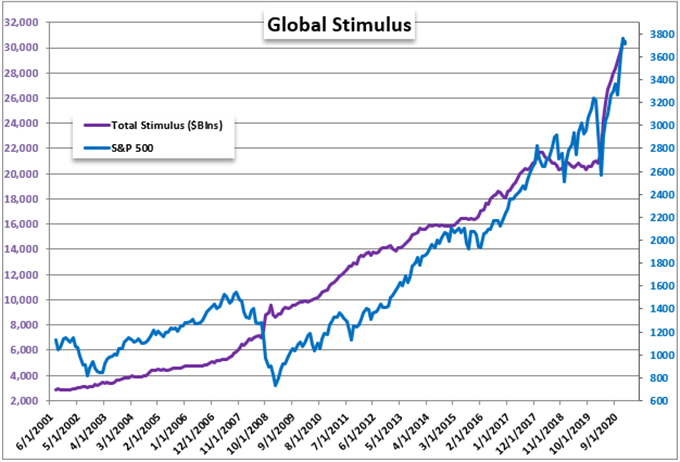
Chart Created by John Kicklighter with Data from FRED and Bloomberg Terminal
Growth and Data Offer the Most Potency Through EURUSD and GBPUSD Friday
From the systemic to the specific, there are more tangible updates that can be followed for price action in these final hours of trade this week. Remarkably this past session, there were growth forecast updates for both he United States and Eurozone – and the contrast is likely adding more anguish for officials from the latter economy. A Wall Street Journal survey upgraded the outlook for the former economy from a 4.3 percent projection in 2021 back in January to 4.9 percent growth in this most recent polling. In contrast, the European Commission downgraded its own forecast for the local economy from 4.2 percent in November to 3.8 percent. Despite this divergence, EURUSD held up with seemingly little regard for the numbers. I will remind that the ECB has taken issue with this pairs’ buoyancy despite fundamentals and history back to 2014 shows they have been moved to push the market when they feel it justified.
| Change in | Longs | Shorts | OI |
| Daily | -1% | -4% | -3% |
| Weekly | 4% | -10% | -5% |
Chart of EURUSD with 50-Day Moving Average (Daily)
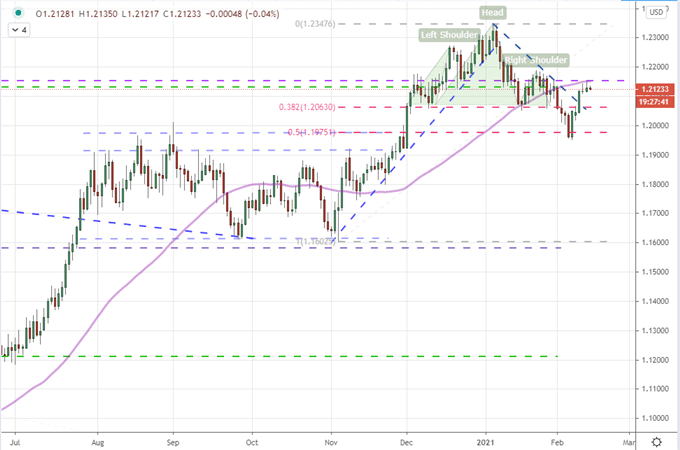
Chart Created on Tradingview Platform
There is no guarantee that GBPUSD will be able to generate a more direct response to its own fundamental stirrings through Friday, but it nevertheless has the most robust economic docket to digest. From the Sterling’s side, we have December/4Q GDP updates, the trade balance, industrial production and January’s GDP estimate. For the US Dollar’s part, the University of Michigan consumer confidence survey for the current month has been known to generate volatility for the USD in the past. More than anything, though, the pair’s rounding back from multi-year highs and slipping slowly below 1.3800 holds more weight in my eyes.
| Change in | Longs | Shorts | OI |
| Daily | 3% | -7% | -3% |
| Weekly | 4% | -10% | -5% |
Chart of GBPUSD with 50-Day Moving Average (Daily)
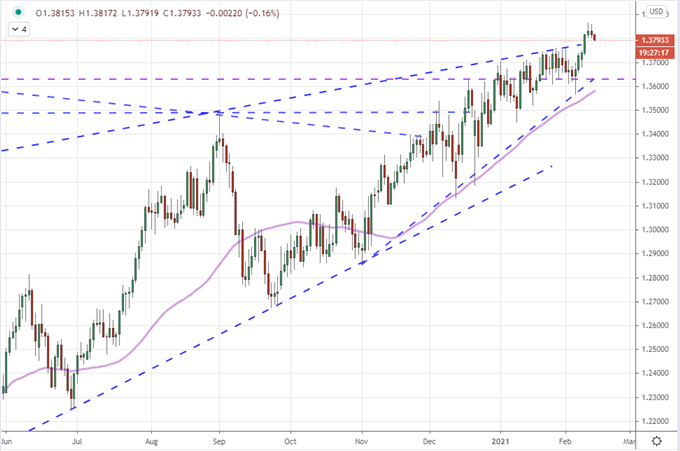
Chart Created on Tradingview Platform

.


