


Russell 2000, S&P 500, Bitcoin, EURUSD, GBPUSD, USDJPY Talking Points:
- Risk appetite continues to edge higher, but the high profile fad trades like GameStop, Dogecoin and Silver have relinquished their lead
- While the S&P 500 is hanging on just shy of record highs, the lack of range raises concern while the small-cap Russell 2000’s 7-day climb seems a hold over of preferences
- A Dollar retreat this week faces a fundamental test in Fed Chair Powell’s semi-annual update on the group’s outlook – can it charge or reverse the USD’s run?

Risk Appetite Remains Sans the Concentrated Speculative Tags
If we were to do a speculative appetite check of the global financial system, we would still find the risk-leaning benchmarks performing well – even if it isn’t under the leadership of the more arcane measures. Doing a health check of the January’s top performers, the Reddit-charged tickers renowned for the leverage in the hedge fund-built short interest continue to slide into irrelevancy. What raised the likes of GameStop and AMC to the status of global macro benchmarks was the sheer volume and volatility registered through the second half of this past month. The incredible rate of gain through the period was a by-product. Yet, as both interest and activity levels fade, their role in upending the financial system founders. That said, there are still measures that hold on to their incredible performance metrics month-over-month – like Dogecoin – but they draw less conviction for representing a new era of the capital markets.
Read about how the rise retail can be a signal for a market mania.
Chart of Gamestop and Dogecoin to USD (Daily)
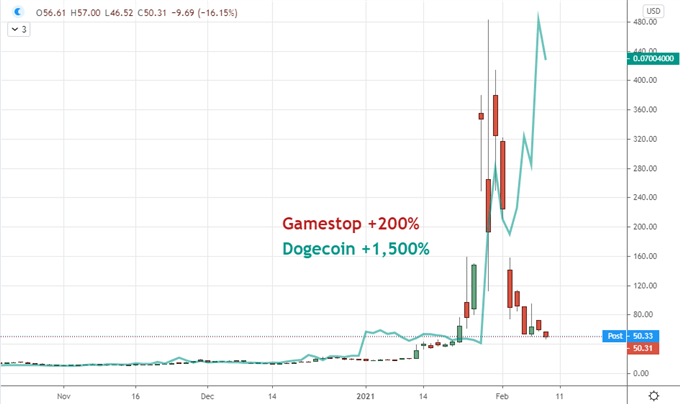
Chart Created on Tradingview Platform
Though there have been some remarkable retreats among the hierarchy of speculative benchmarks, there are also those measures that continue to tout appetite for risk/return. Bitcoin retains its own incredible appeal as it moderates its climb above the $45,000-mark. The benchmark cryptocurrency didn’t materially extend Monday’s 19.5 percent charge following the news that ‘disruptor’ favorite Tesla had purchased $1.5 billion in currency alternative and was prepared to accept the fiat challenger as payment for its cars and products. I maintain that there are qualification issues to BTC’s – and crypto at large – suitability as alternative to the Dollar and other major currencies, but that isn’t the judgement currently being made apparently.
Poll Gauging Respondents’ Conviction in the Future of Bitcoin
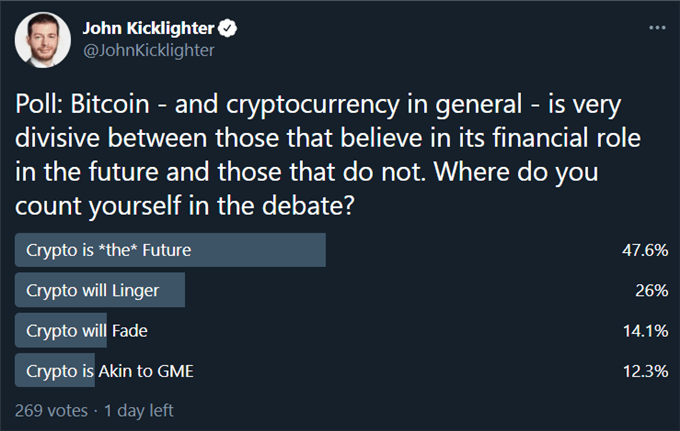
Poll from Twitter.com, @JohnKicklighter
Shifting attention from the esoteric to the more traditional, the benchmarks most frequently on my radar are still supporting the favorable risk bearing on their own. US equity indices only one day and a fraction of a percent away from their respective record highs. The S&P 500 ended a six-day consecutive advance without signaling any serious collapse back to earth. I will note though that the benchmark was eerily quiet through this past session. Tuesday’s range was only 0.4 percent of current spot which would be the smallest relative trading span since December 24th – clear holiday conditions. To find the last instance of comparable quiet during ‘normal’ conditions, we have to look back to January 21st, 2020.
Chart of S&P 500 with 100-Day Moving Average and Consecutive Candles (Daily)
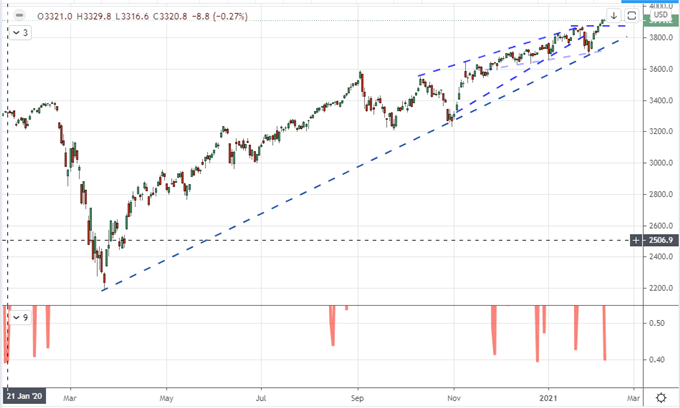
Chart Created on Tradingview Platform
Being a strong believer in the power of relative value for perspective on market bearing, I will note first that the Russell 2000 was in a similar boat for underwhelming performance for Tuesday. However, the small-cap index was putting up the best performance among its larger peers. In fact, the 0.4 percent gain would earn a seventh consecutive advance would match the run through December 2019 and not find a period that ran longer until February 2019. For further comparison, the relationship of spot to the 100-day moving average (disparity index) is the highest I have seen in over 35 years of historical data. Perhaps there is some holdover of the retail charge on the nature of the complacent speculative reach after all.
Chart of Russell 2000 Index, 20-Day Mov Avg, 100-Day Disparity and Consecutive Candles (Daily)
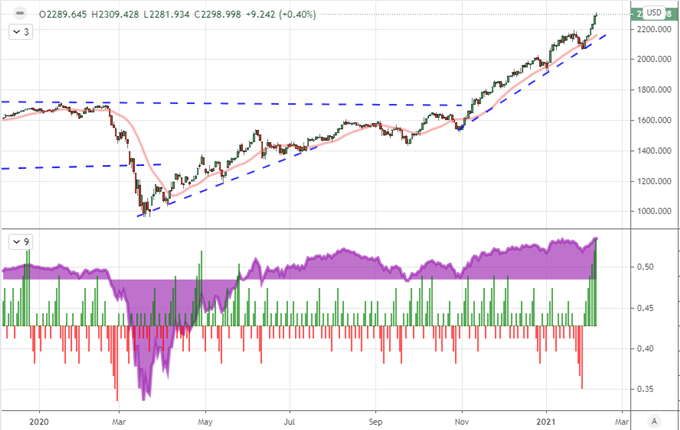
Chart Created on Tradingview Platform
Top Fundamental Risk for Wednesday…And the Week?
If you were looking for a fundamental basis for the market’s appetites this past session, it would have been a struggle. There wasn’t much in the way of systemic headline that has carried through this week. There is of course the discussion of progress on the United States’ long-overdue stimulus program which President Joe Biden is attempting to secure with an incredible $1.9 trillion price tag. Even some well-known democratic financial figure heads are voicing concern about that scale, but speculators are hardly going to raise concern considering what it does for their short-term positions. The decline in coronavirus cases and the rise in vaccinations is another point for speculative interest, but that seems to be too nuanced a progression for risk trends to truly bite on the standing. Perhaps Fed Chairman Jerome Powell will give greater definition to the picture of growth with these landscape features – and what policies will develop around those views – today when he provides his semi-annual update.
US Year-Over-Year Rate of Change in CPI and Wilshire 5000 Index (Monthly)
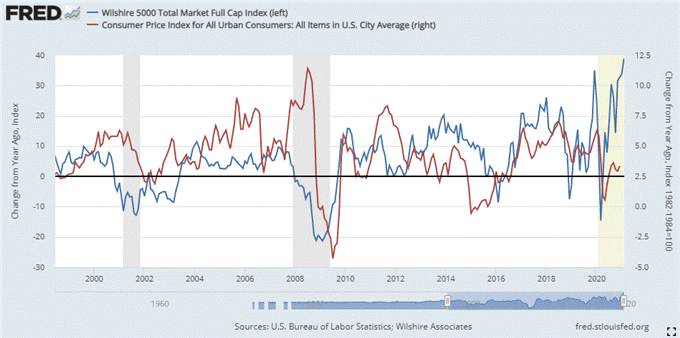
Chart Created on Federal Reserve Economic Database
The leader of the Fed is on tap at 19:00 GMT to delivery his view on the state of the economy which inevitably ventures into growth forecasting with the market’s natural interpretations as to what it means for capital markets’ prospects as well as the course it sets for the Greenback. Speaking of the Dollar, the benchmark currency has extended its slide through this morning’s trade to notch some noteworthy technical breaks. EURUSD for example broke back above its 38.2 percent Fib of the past six month range which happens to coincide with a ‘neckline’ on a head-and-shoulders pattern then on to the 20-day moving average. I don’t think this simply flips the switch on conviction and momentum, but it is certainly drains any momentum for the bulls.
| Change in | Longs | Shorts | OI |
| Daily | -1% | -4% | -3% |
| Weekly | 4% | -10% | -5% |
Chart of EURUSD with 20-Day Moving Average (Daily)
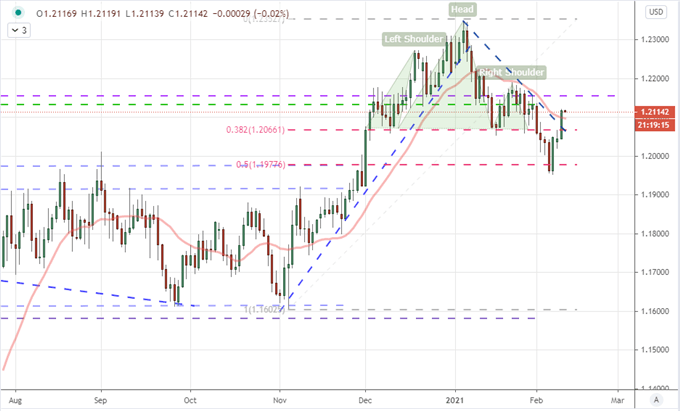
Chart Created on Tradingview Platform
Dollar-Based Majors With Greater Technical Weight
As technically-dense as EURUSD may be, it lacks for the intrigue of a pair that is attempting to reach further than its near-term chart milestones insinuate. There is perhaps still some mystique for the likes of GBPUSD. For most majors, the break lower for the Dollar pulls us back into established ranges. However, here, the move pushes the pair to its highest levels since April 2018. That is clearly a consequential high, but the implications for follow through are far from assuring. The bearish case for the Greenback may have nodes to follow, but it is far from certain. The same goes for the British Pound on its bullish urgency – there are guidelines but hardly the case for outright momentum.
| Change in | Longs | Shorts | OI |
| Daily | 3% | -7% | -3% |
| Weekly | 4% | -10% | -5% |
Chart of GBPUSD with 20-Day Moving Average (Daily)
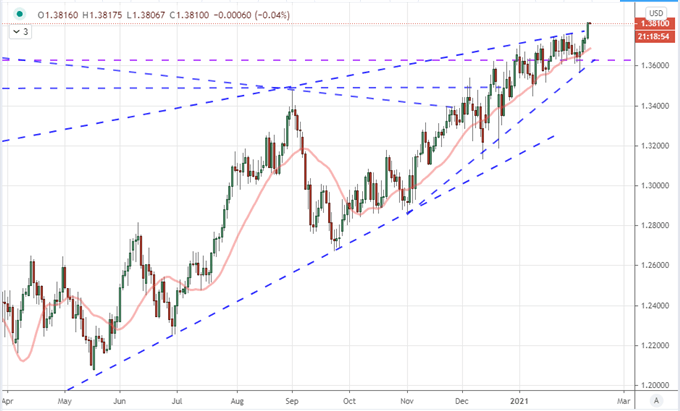
Chart Created on Tradingview Platform
And, if we are looking for sheer volatility, no other major would register the kind of relative activity that USDJPY displayed. Having been rejected by the 200-day moving average, the pair posted its biggest slide since the terminal slump back in early November. Now, a bearish move is complicated by the 100-day moving average immediately below around 104.50 then former resistance as new support just a little further down. This isn’t an open corridor for momentum to unfold, so stop-and-go may prove the norm unless something slices through the murk to charge conviction one way or the other.
Chart of USDJPY with 100 and 200-Day Moving Averages and 1-Day Rate of Change (Daily)
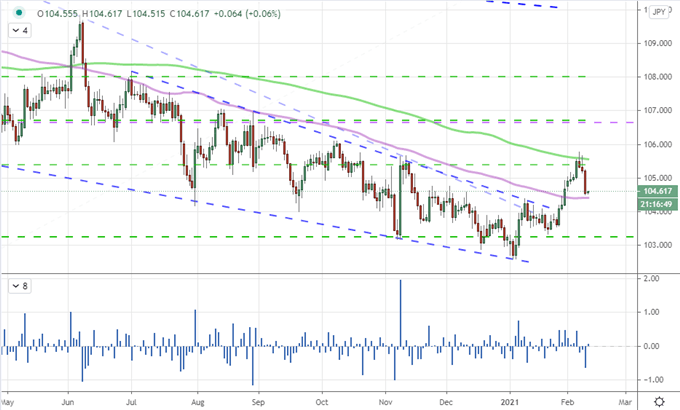
Chart Created on Tradingview Platform

.


