


Tesla, Bitcoin, Nasdaq, USDJPY, EURUSD Talking Points:
- Risk aversion took over Monday with a broad downshift in a wide range of assets with a Nasdaq 100 sharply outpacing the Dow
- Bitcoin and Tesla offered the sharpest reversal Monday with moves that contrasted remarkable climbs to their respective record highs
- A rebound from the Dollar has caught more traction on DXY and EURUSD, but perhaps USDJPY offers a better signal of intention with many majors still ‘on the cusp’

Risk Aversion Catches from the Top Down
Through the end of last week, the range of risk-leaning assets managed to extend to new highs – with the major US indices all notching records of their own. That was a move seemingly in defiance of lasting fundamental uncertainties that would shift the focus around fundamental conviction onto seemingly unflappable elements and forward-looking fodder like the next round of US stimulus expected from the incoming Biden administration on Thursday. Yet, all of that justification was seemingly for naught. This past session, the range of risk-leaning assets that I like to follow for overview on speculative conviction signaled a swoon that seemed to outweigh a run of focus on stimulus, favorable growth forecasts and the din of a bid based on complacency. Among the three US indices I monitor, there was an acute intensity skewed by speculative favor. The Nasdaq 100 suffered the worst of the negative sentiment Monday with a -1.55 percent drop followed by the broader S&P 500’s -0.66 percent drop while the blue-chip Dow was the most restrained with its own -0.27 percent slide.

Chart of Nasdaq 100 with 20-Day Moving Average overlaid with Nasdaq-to-SPX Ratio (Weekly)
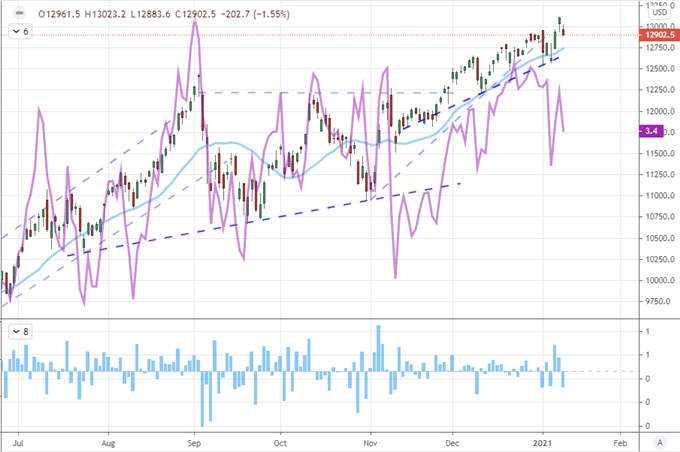
Chart Created on Tradingview Platform
Risk aversion wasn’t just a sign among the US indices. It would show up across the spectrum from the most overt speculative milestone to the more stoic measures that tend to draw justification to even the havens on the opposite end of the spectrum (that would be bid rather than pressured lower). Global indices took a dive as did the EEM emerging market ETF and junk bonds with a gap lower to open the week. Even commodities with a growth lean and carry trade – measures more resistant to wobble to recently – dropped this past session. When it comes to my establishing conviction in a risk move, correlation across generally unrelated but highly important assets like this stands as one of my top barometers. Yet, it very early yet to say this is a trend. Then again it has to start somewhere. I asked traders what they though the best early signal for faltering speculative appetite would be and was happy to see the majority believed it to be the broader and longer-serving milestone of the Nasdaq or FAANG grouping.
Poll Asking What Social Traders’ What ‘Risk’ Measure Would Give the Most Accurate Signal
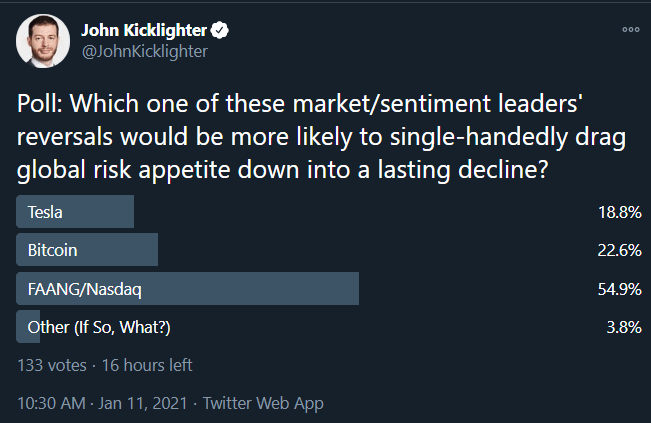
Poll from Twitter.com, @JohnKicklighter
The Extremes of the Bubble: Tesla and Bitcoin
As we monitor the standings of risk appetite, I believe it is worth watching the performance of speculative assets further at the extremes of the spectrum. Perhaps at the very top of the list is Tesla which was pushing a more than 750 percent return year-over-year through the end of last week but which took a -7.8 percent drop on Monday. Volatility (on the way up) begets more volatility. What I find even more remarkable a sign of the speculative overindulgence is the charge in Signal Advance (SIGL), a pink sheet stock which has surged more than 11,000 percent at its peak these past three days on the misunderstanding of a remark by Tesla founder Elon Musk. Despite the financial media’s highlight of this confusion Friday, the rally continued this opening session. Are there any more blatant signs of speculative reach?
Chart of Tesla Overlaid with SIGL and 1-Day Rate of Change (Daily)
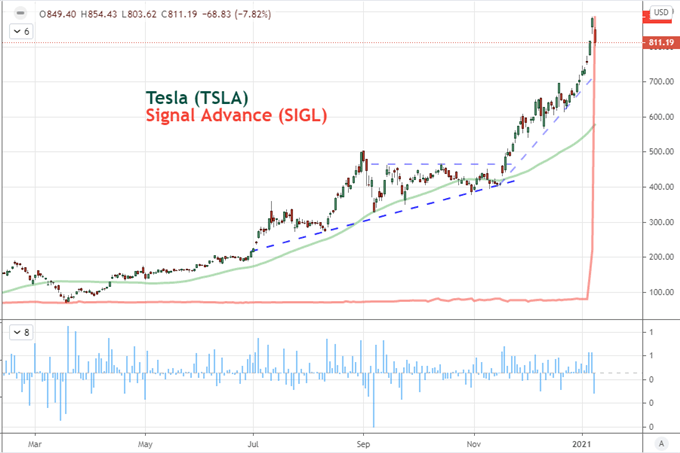
Chart Created on Tradingview Platform
Perhaps one asset in my list to give Tesla shares a run for their money on the reach is Bitcoin. Having doubled in value in less than a month, the most familiar of the cryptocurrencies – which has seemingly drawn strength where other assets have strained on traditional economic matters and continued through the weekend – took a dive over through the weekend and into Monday. From its peak last week, BTCUSD is down 15.5 percent through Monday’s close and was off as much as 20 percent through the session low. That is a large drop, but a natural by-product of this degree of volatility.
See our history of major financial bubbles to see if what similarities you see to the current Bitcoin climb.
Chart of Bitcoin overlaid with Tesla and 60-Day Correlation Coefficient (Daily)
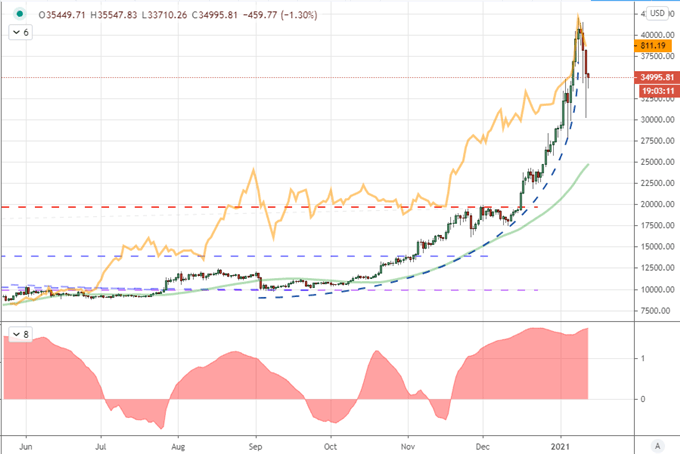
Chart Created on Tradingview Platform
Should This Trend Hold, What Safe Havens are on Tap
We are only a single day’s break from a remarkable consistent climb for speculative markets, so it is far too early to label a trend. That said, I like to always have options in mind should my – or the market’s – conviction tip into the more committed range of the spectrum. While the Dollar and VIX volatility index rose, Treasuries and gold were reticent to follow the lead for safety. That is perhaps an indication that markets are not yet committed enough to rouse the full spectrum of assets, but I will point out that those majority of those that replied to my poll on what hedge they preferred to a stretched risk position favored a ‘long haven’ view – though perhaps the collective judgement deserves scrutiny when the second top choice was diversification in ‘disruptors’ like Bitcoin and Tesla – which I consider instead concentration in risk.
Poll Asking What Social Traders’ Top Hedging Approach is for Current Markets
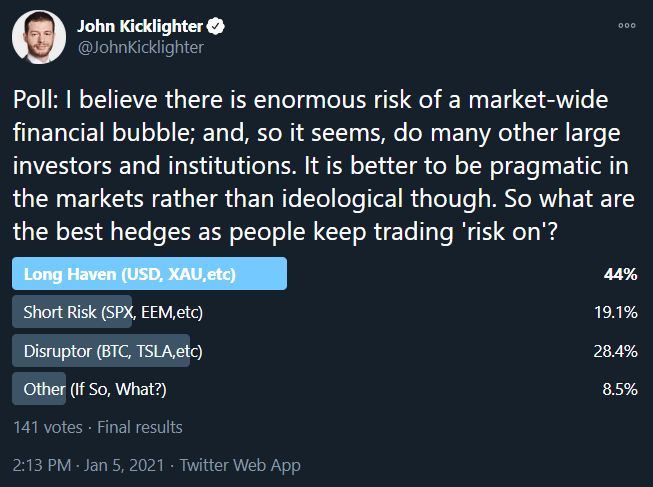
Poll from Twitter.com, @JohnKicklighter
One typical haven that was prominent on my radar through Monday was USDJPY. This is because this particular benchmark is not a straightforward measure. On the one hand, this qualifies as a carry trade which is perhaps why most of the other Yen crosses were sliding on the day. Yet, where the typical ‘funding currency’ would advance amid risk aversion, the Dollar’s appeal as a liquidity haven has perhaps superseded interests. Yet, the Greenback usually finds its strength in this role when there is a more severe, sweeping shift in sentiment. I wouldn’t say this is at hand just yet.

Chart of USDJPY with 50-Day Moving Average (Daily)
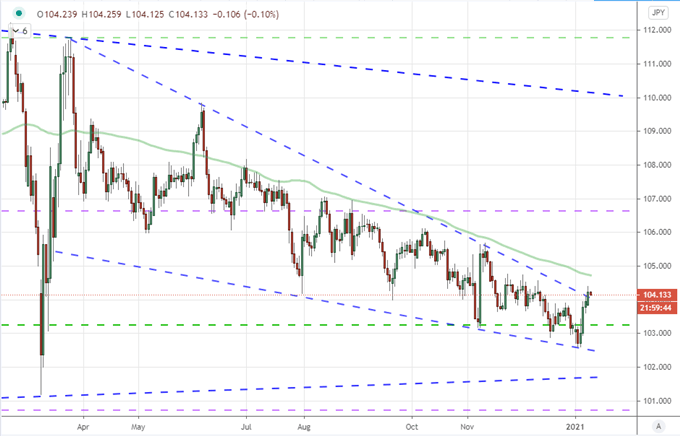
Chart Created on Tradingview Platform
The Dollar’s Lift May Not be Risk Related
While global risk aversion may not be yet at hand, there is no doubting the Dollar’s strength. The DXY Index rose for a fourth straight session to match the most robust advance in four months. What is more impressive is that this occurs with a high profile technical break on a trend that has driven the currency to multi-year lows. The urge for reversal is there for those that are looking for a reason, but it is important not to over-stretch. If a further technical milestone is necessary, there are imminent boundaries for the likes of AUDUSD and NZUDSD, but I put the greater emphasis on EURUSD which has returned to its historical range midpoint at 1.2150.

Chart of EURUSD with 50-Bar Moving Average (Weekly)
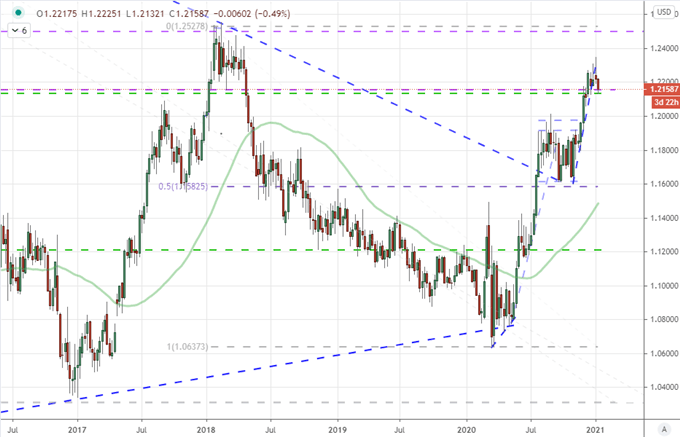
Chart Created on Tradingview Platform
A fundamental thread is perhaps the more convincing threads in my book. Yet, safe haven status is a more extreme designation for the Dollar. Relative growth may be a separate matter to follow. Ahead, we have the release of the NFIB’s small business and IBD economic sentiment surveys. If relative measures are more effective, however, perhaps the focus on Covid cases and vaccinations is the more weighty factor. At the top of my list is the stimulus considerations. On the one hand, more stimulus is considered a backdrop for growth potential which is where the anticipation for President-Elect Biden’s plan on Thursday comes in – though anticipation didn’t keep risk assets perky. Alternatively, a curb on this easy capital can lead to higher value assets which finds quite a bit of speculation that the Fed is already starting to consider tapering of its open-ended stimulus program.
Chart of S&P 500 and Fed Balance Sheet in Billions (Weekly)
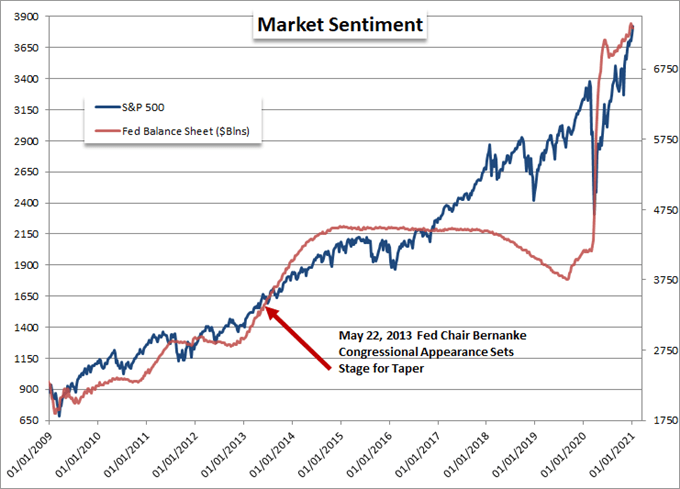
Chart Created by John Kicklighter with Data from Bloomberg Terminal and Fed’s Economic Database

.


