


Nasdaq, Dow, Bitcoin, Tesla, EURUSD and USDJPY Talking Points:
- Despite the worst opening day to start a year since 2016 and mid-week political stability risks hitting the market, the Nasdaq, S&P 500 and Dow all ended at record highs
- A rise in Coronavirus cases globally and a distinct drop in December NFPs didn’t seem to knock major risk assets off course
- Between a thin economic docket and transitional systemic themes, top event risk in the week ahead is likely President-Elect Biden’s stimulus plan

A Volatile Start to 2021 Nevertheless Sees Risk Assets Pushing New Records
The first trading week of the new year has drawn to a close, but not before we were met with an impressive level of volatility – particularly for this time of the year. In the very opening move of 2021, risk took a definitive slide which seemed to cater to the latent concerns that the climb through December and months previous were more a string of fundamental reliefs rather than a genuine outlook for growth and return. With Wednesday’s headlines of a mob breaking into the US Capitol building, it seemed that burgeoning concern could find traction in political stability risks in the world’s largest economy. Yet, these concerns proved insufficient to snuff out the long-standing speculative default in complacency. By week’s end, the Dow, S&P 500 and Nasdaq 100 all managed to close out at record highs. In the wake of the wobble, the S&P 500 – the most heavily traded of the indices in financial derivatives – would also notch its biggest bearish ‘tail’ (or wick) indicating a bullish intra-period reversal in since the week of April 20th.
| Change in | Longs | Shorts | OI |
| Daily | 1% | -1% | 0% |
| Weekly | 15% | -13% | -1% |
Chart of S&P 500 with 50-Week Moving Average and ‘Wicks’ (Weekly)
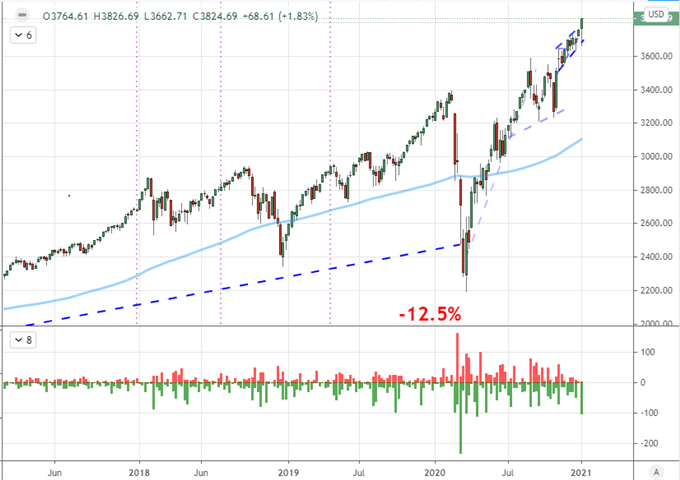
Chart Created on Tradingview Platform
Sentiment in the broader market isn’t simply a look though the major US equity indices. Whether rising, falling or forging extremes; the collective measure of speculative appetite is best gauged by a comprehensive overview of performance across a wide range of assets that are otherwise distinct but for the universal connection to sentiment. That said, a look across the spectrum shows ‘risk on’ is not just well placed but further indulging extremes. Encompassing record highs on the German DAX and three-decade peaks from the Japanese Nikkei 225, the VEU rest of world (excluding US) equities ETF push its highest since 2007. The same was true of the EEM emerging market ETF. Even more distinctly growth tied measures were swelling with oil climbing to 10 months highs. Pair this to the throttled safe havens like the Dollar’s multi-month slide and Gold’s breakdown through just this past week’s end, and it seems the compass bearing is clear.

Chart of VEU Rest of World Equities ETF Overlaid with US Crude Oil (Daily)
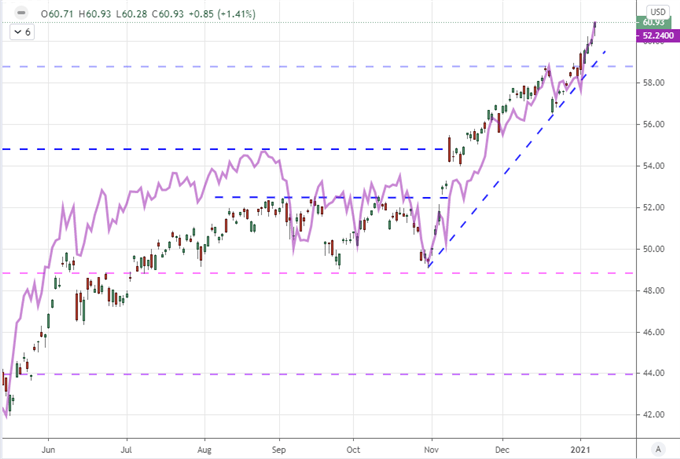
Chart Created on Tradingview Platform
Watch the Bubbles Closely – Like Those from Tesla and Bitcoin
As robust as the signal for sentiment in markets may be, it doesn’t full qualify the degree of conviction that urges market participants to add to exposure for record cost in pursuit of increasingly anemic yields. The drive for most investors at this stage is an exaggerated appetite for capital gains – buy high, sell higher. I believe this is perhaps the strongest compulsion for feeding capital into Tesla shares and Bitcoin, two of the most prominent examples of excess in popular financial circles. The auto manufacturer holds the title of the 5th largest market cap among US corporations yet its ranking by revenues in 2020 puts it at 124th. Meanwhile, BTCUSD’s market cap has surpassed $750 billion with prices having doubled in mere weeks even though one of the principal arguments touting the crypto is its appeal as an alternative to fiat currencies. Currencies are not supposed to be this volatile. Both of these reflect hallmarks of bubbles. That doesn’t mean they have to collapse immediately, but such moves inevitably end and most often messily. In gauging broader risk, it is useful to keep extremes near the front of the lens.
See our history of major financial bubbles to see if what similarities you see to the current Bitcoin climb.
Chart of Tesla with 3-Day Rate of Change Overlaid with Bitcoin (Daily)
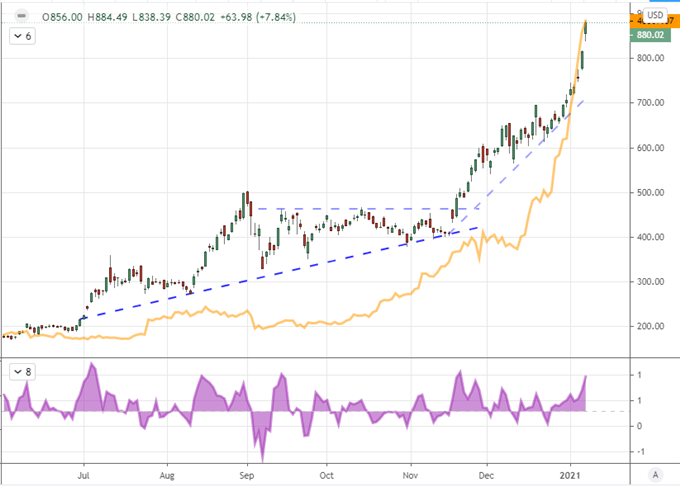
Chart Created on Tradingview Platform
Markets are Once Again Selective of Their Fundamental Motivations: Next Up is Stimulus
In more ‘normal’ historical conditions, various fundamental themes can exert pressure to lift or lower the markets. However, for much the past decade, the current has generally absorbed favorable inputs and downplayed all but the most caustic of the weights to develop. Evidence of a prevailing bias was the past week’s general disregard for the climb in coronavirus cases globally (with the subsequent economically-throttling lockdowns) and the specific downplay of the December NFPs (nonfarm payrolls). Against expectations of a 71,000 net addition of jobs in the US, the country instead shed -140,000 positions. That didn’t seem to dissuade either the S&P 500 or the Dollar.
Chart of US NFPs Overlaid with ADP Private Payrolls and Payrolls ‘Surprise’ (Monthly)
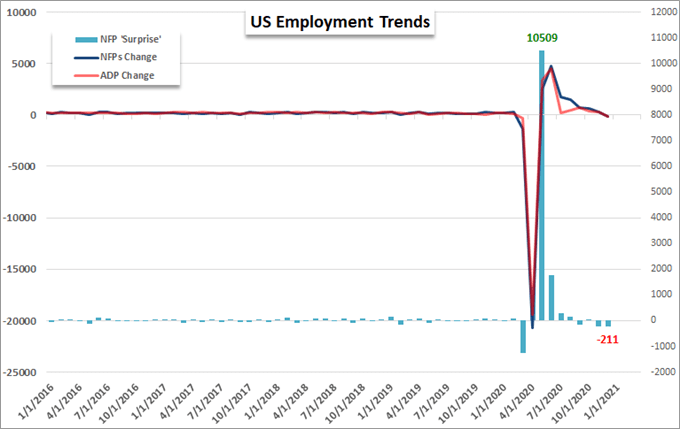
Chart Created by John Kicklighter with Data from St Louis Fed’s Economic Database
I found the Greenback’s traction through the end of this past week remarkable. While some would say the currency is simply due a bounce after a 13 percent drop in nine months. Yet, that doesn’t seem practical given there have been numerous fundamental opportunities to help generate distinct traction in that period with no response. A safe haven bid doesn’t seem practical nor does a relative growth advantage after the jobs statistics. Perhaps there some relief rally in the curb in political instability; but if that is the case, the lift will have to be replaced by another motivator or likely falter once again. The most potent source of strength for the Dollar, which could also benefit stretched US indices, ahead is the possibility of a large stimulus. President-Elect Joe Biden announced that he would be announcing his stimulus program on Thursday and that the support would be “in the trillions”. Consequences later, mania now it would seem.
Chart of S&P 500 and Aggregate Stimulus from Major Central Banks in $Blns (Monthly)
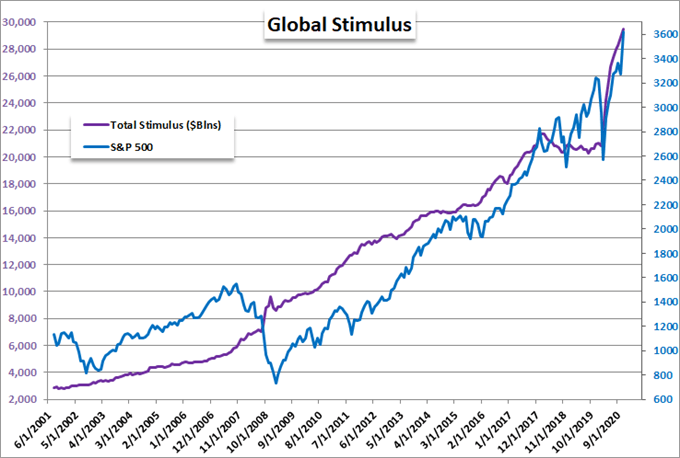
Chart Created by John Kicklighter with Data from Bloomberg Terminal
Options Should the Dollar Recovery Take or Falter
Considering the Dollar finds itself in a position to either commit to a true rebound or once again cut short the attempt and return to a larger trend, I like to look for options that would suit either outcome. In the former case for a genuine USD recovery, there seems no better cross for me than EURUSD. The technicals are fairly straightforward with a clean break lower from the rising trendline support formed in the past two months. A break back below 1.2150 would move the pair back below its historical midpoint. An equally-appealing aspect to EURUSD is the fact that it is the most liquid currency pair and perhaps asset overall. If it is committing, it would carry more weight in pull others along for the ride.

Chart of EURUSD with 20-Bar Moving Average (Daily)
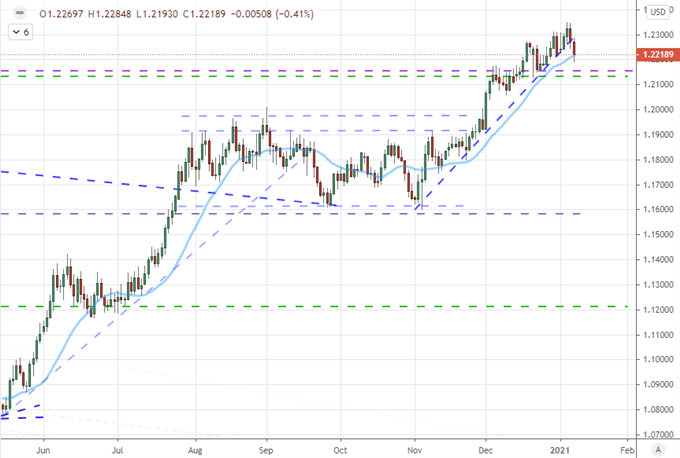
Chart Created on Tradingview Platform
Alternatively, if the Dollar’s attempt to rebound falls apart yet again, I prefer to avoid pairs that are already so stretched in their steady tempo of the past months. That diminishes the appeal of EURUSD, AUDUSD and NZDUSD even though they have favored their bull trends. Instead, USDJPY’s predilection for range makes it more suitable with more explicit technicals to such a picture and settings to encourage more reasonable notions of duration and objectives.

Chart of USDJPY with 50-Day Moving Average (Daily)
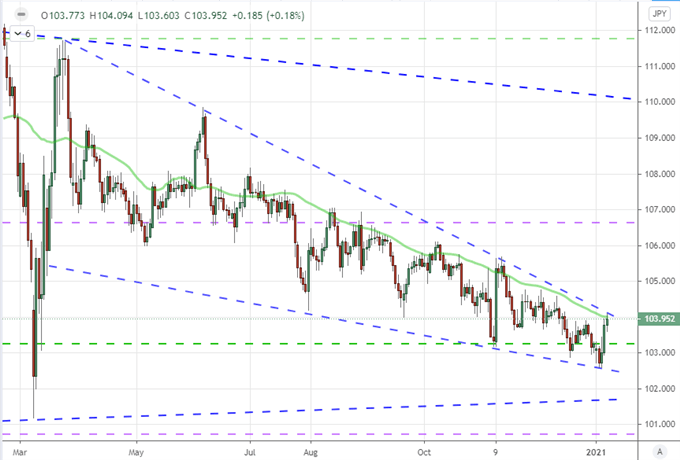
Chart Created on Tradingview Platform

.


