

Dollar and S&P 500 Talking Points:
- Amid a run of economic data, the US ISM manufacturing report seemed to draw more attention that earned more market impact than expectations would assume
- Risk trends were mixed this past session but the S&P 500 and Nasdaq 100 would still notch a record high – perhaps helped by renewed US stimulus chatter
- Despite the fundamental talk, the Dollar secured an unmistakable bearish break reflected in pairs like EURUSD and GBPUSD – but follow through is a different matter
A Return to Prevailing Trend as Short-Term Seasonality Wobbles Pass
On Monday this week – the final trading session for the month of November – there was a notable counter-trend shift. The slip with a gap to the downside and further lost ground during the active session from the likes of the Dow Jones Industrial Average reflected on market sentiment that was unmistakably sidetracked. Yet, the recognition of fundamental dislocation that this could have evolved into seems as if it was quickly snuffed by the market’s prevailing comfort for speculative reach. Through this past session, a return to prevailing trend showed up in a significant way with a record high push for the S&P 500 and Nasdaq 100. Yet, where risk appetite could have established more foundation, there was an uneven performance to the drive with global indices, emerging markets, commodities and carry trade presenting a mixed bag. This is not to say the SPX can’t forge ahead, but the certainty of the trend should definitely be called into question if not steadily fed through fundamental motivation.
Chart of the S&P 500 with 20-Day and 200-Day Moving Averages and Daily Gaps (Daily)
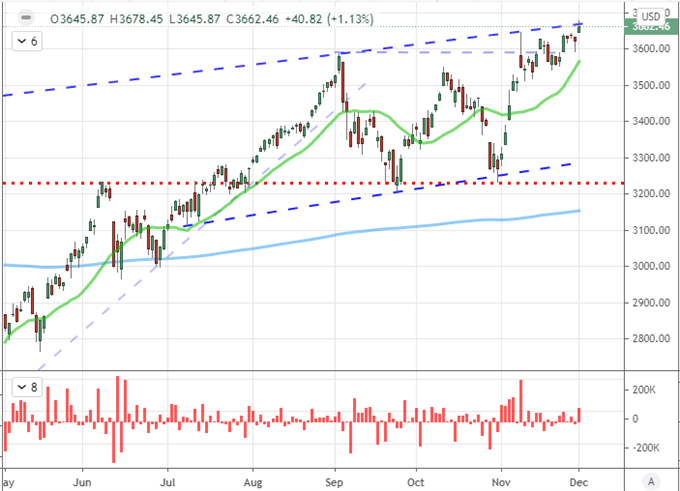
Chart Created on Tradingview Platform
To be a steady – if annoying – voice to the seasonal expectations from the investing masses, the S&P 500 (as a risk benchmark) averages an impressive December. As volume and volatility (via the VIX) traditional slide, market performance tends to remain impressively high for bullish interests. This is far from a certainty year-in-and-year-out, but the norms are founded on statistically relevant observation. That said, I do think a slide in activity and participation are well founded given circumstances, but appetite for risk trends is absolutely variable depending on the headlines moving forward and against the onus of markets already pushing record ‘cost of entry’.
Chart of Seasonal S&P 500 Performance, Volume and VIX
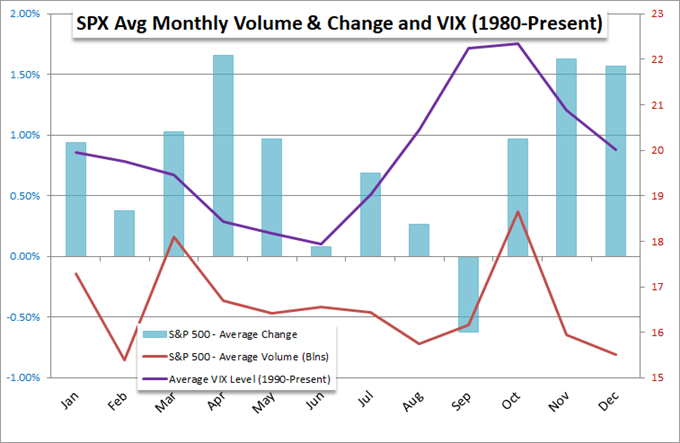
Chart Created by John Kicklighter with Data from Bloomberg
Key Fundamental Themes Still Matter
In keeping tabs on December bearings my interest is in the fundamental backdrop that can define speculative charges. On the downside, we were reminded of the uncertain outlook by Fed Chairman Powell in testimony, the Reserve Bank of Australia in its policy update and ISM’s US manufacturing activity report. Such doubt is exacerbated by a market that is pushing record relative positioning. That is to not to mean there isn’t a favorable fundamental backing to be found in the market. The hopes of a vaccine remains a point of favorable tail wind. The volatility in Moderna stock in particular Tuesday was a point of interest. Another systemic – though perhaps short-term – shot of enthusiasm is the anticipation of stimulus out of the US. It was reported that a bi-partisan group of senators was readying a $908 billion stimulus program that would make allocation for a PPP among other targeted efforts. It should be said, however, that this is still far from the House’s regular reference to more than $2 trillion counteroffers pre-election.
Chart of the Dow Industrial Average with 1 Month Rate of Change (Monthly)
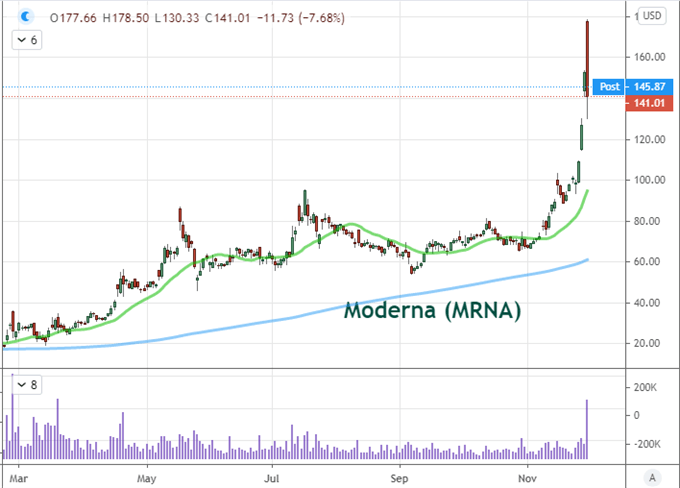
Chart Created on Tradingview Platform
The Dollar Suffers A Serious Technical Break
Whether the disparity in coronavirus cases, the disparity in stimulus efforts or a deviation in growth forecasts; the US currency has suffered a material performance discount relative to its global counterparts. The DXY Dollar Index this past session marked an unmistakable technical break below 92 after days of simple meandering around the figure. We gain a better appreciation of the technical implications when consulting the weekly or monthly chart – the latter of which has signaled the break of a 38.2% Fib retracement of the past decade’s range.
Chart of the DXY Dollar Index with 20-Month Moving Average (Monthly)
Chart Created on Tradingview Platform
The largest component of the DXY Index is EURUSD. This benchmark pair earned its biggest single-day rally since the anti-risk, pandemic volatility in March – and ultimately the third largest rally since January 12th, 2018. More than the tempo, the clearance of a multi-month range to trade at a multi-year high above 1.2000 is a significant technical milestone. Was that the cue that suggests the market is shifting its focus and support towards the Euro for alternative haven appeal, stimulus preference, trade war considerations, etc? It is possible but I remain generally dubious of trend development.
Chart of the EURUSD with 1-Day Rate of Change (Daily)
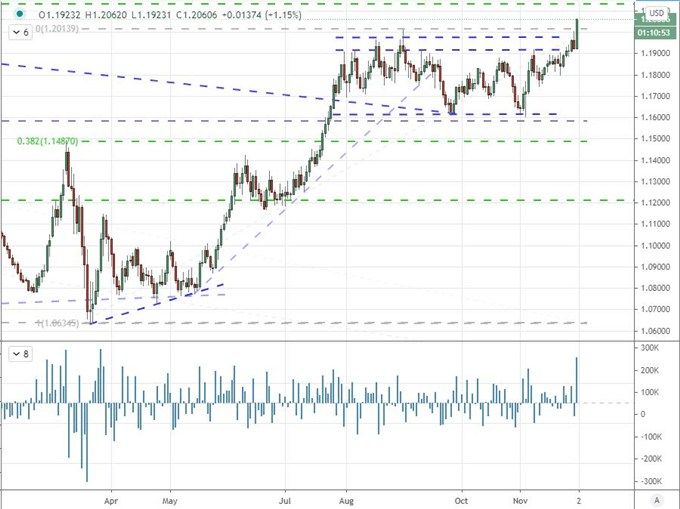
Chart Created on Tradingview Platform
Ratcheting up the time frame, it is possible to see the bigger technical picture unfolding. While clearing 1.2000 is a significant milestone after months of range development, the sheer scale of the upper boundary becomes clear in a weekly or monthly chart. Having cleared a more-than-decade long descending channel top some months ago, the current upswing looks like the fulfillment in a transition for testing former resistance as new support as a leg to further reversal.
| Change in | Longs | Shorts | OI |
| Daily | 24% | -17% | 7% |
| Weekly | 25% | -31% | -1% |
Chart of the EURUSD with 20-Month Moving Average (Monthly)
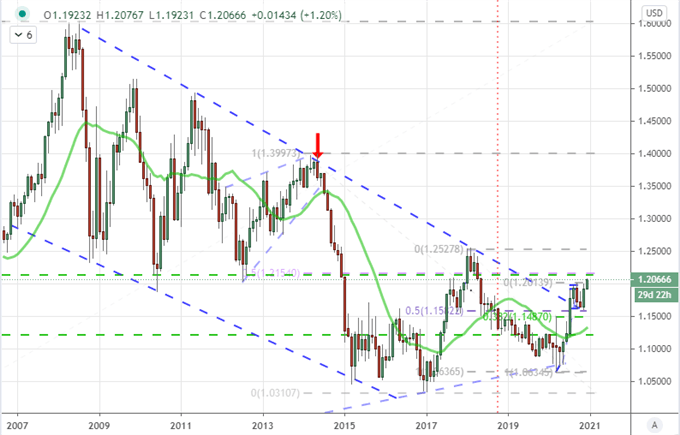
Chart Created on Tradingview Platform
Other Majors with Additional Fundamental Baggage/Motivation
In an unusual turn from the past few years, the world’s most liquid currency cross may hold the keys to meaningful technical development. Meanwhile, some of the alternative Dollar majors have interesting perspective of their own. I would start with GBPUSD. On a technical basis, a break of 1.3400 is a possible break of a trendline that stretches back to the peak of the initial Brexit vote on June 23, 2016. However, I wouldn’t weigh a serious break until 1.3500 gives. That said post-Brexit trade talks are a key component of fundamental discussions now along with post-Covid lockdown steps.
| Change in | Longs | Shorts | OI |
| Daily | 29% | -24% | -2% |
| Weekly | 14% | -22% | -5% |
Chart of the GBPUSD with 20-Week Moving Averages (Weekly)
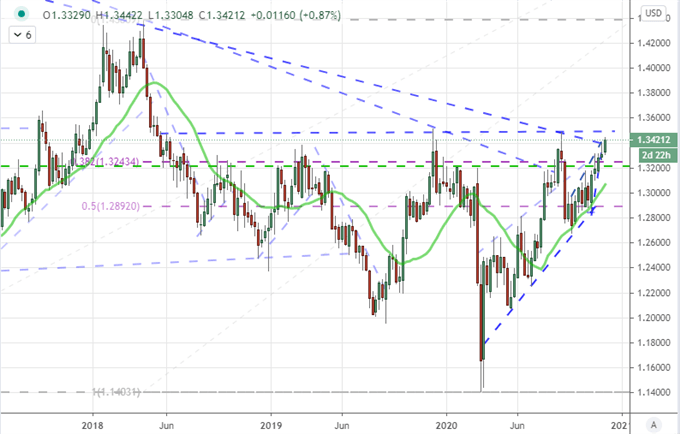
Chart Created on Tradingview Platform
Another USD cross of merit is AUDUSD. Here two, we have a significant anti-Dollar technical barrier to consider (0.7400), but this level has yet to give – even though the likes of NZDUSD keep running and USDCAD has earned its own break this past session. Here, the fundamental crosswinds play a role. There is no doubt a risk implication to account for, but the Australian Dollar is not particularly adept at taking advantage of the situation. Instead, the RBA’s policy hold is a questionable buoy while this morning’s GDP update offers more to chew on fundamentally. If this pair cannot join the break on a basis of ‘risk on’, I will be further concerned about risk appetite and the anti-Dollar drive.
| Change in | Longs | Shorts | OI |
| Daily | 14% | -13% | 2% |
| Weekly | -7% | 10% | -2% |
Chart of AUDUSD with 50-Day and 200-Day Moving Averages (Daily)
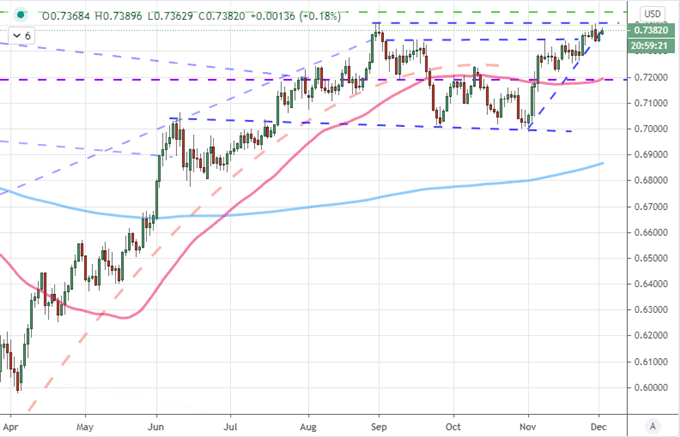
Chart Created on DailyFX.com

.