Dow Jones 30, Nasdaq 100, Nikkei 225 Analysis and Charts
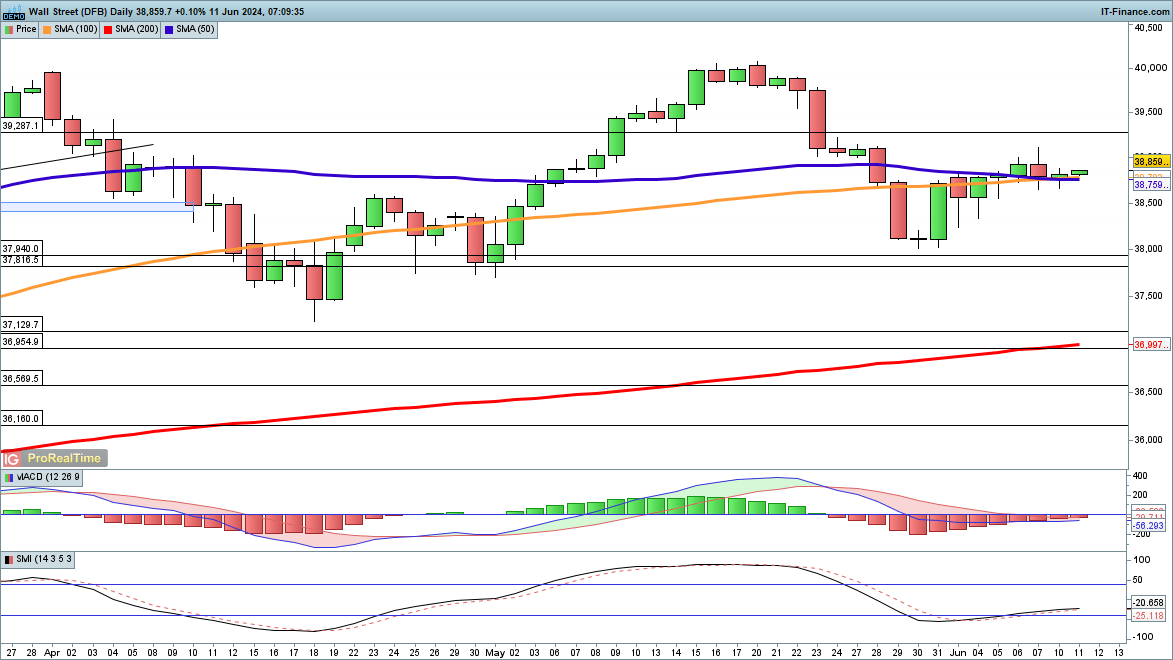
Dow stabilises but struggles to move higher
After dropping back on Friday the index managed to recover on Monday, holding above the lows of Friday’s session. This allows the price to begin a move back towards the previous highs at 40,000, so long as the 50-day simple moving average (SMA) continues to underpin the price.
Short-term weakness targets the late May lows around 38,000.
Dow Jones 30 Daily Chart
| Change in | Longs | Shorts | OI |
| Daily | -18% | 18% | 7% |
| Weekly | -19% | 14% | 4% |
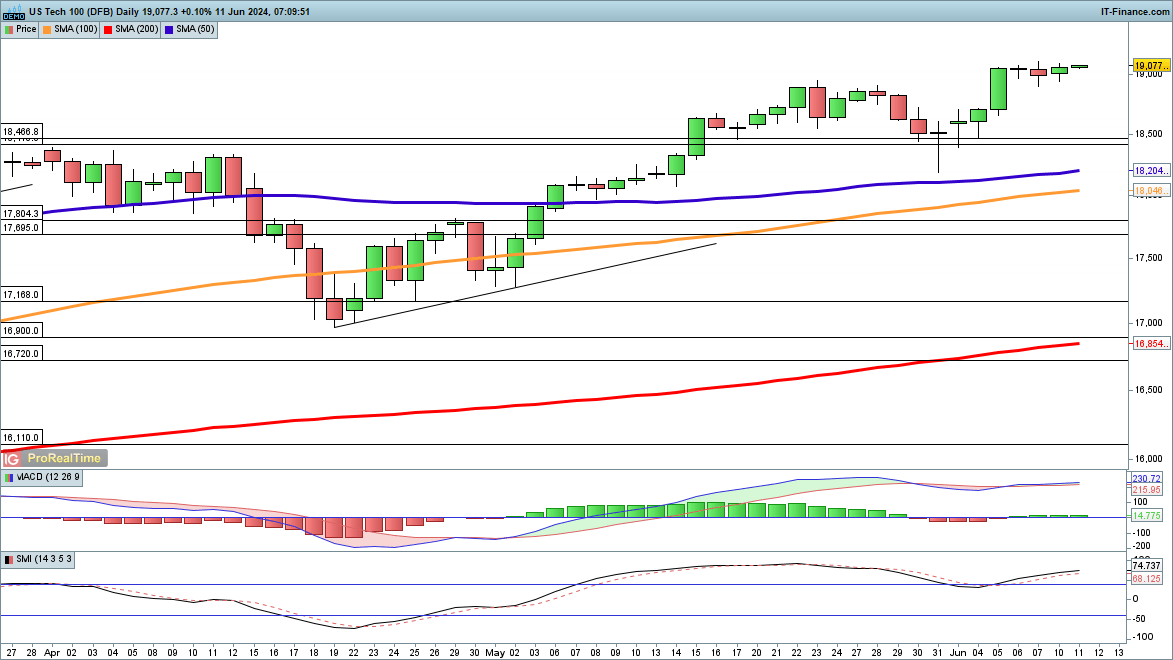
Nasdaq 100 is back at a record high
Apple’s conference weighed on the Apple stock price, but gains for Microsoft and Nvidia helped the index to move higher on Monday, moving back towards the highs seen on Friday.A move to new record highs looks to be in play once again, building on the rally from late May.
A close back below 18,950 might then point to some additional short-term weakness.
Nasdaq 100 Daily Chart

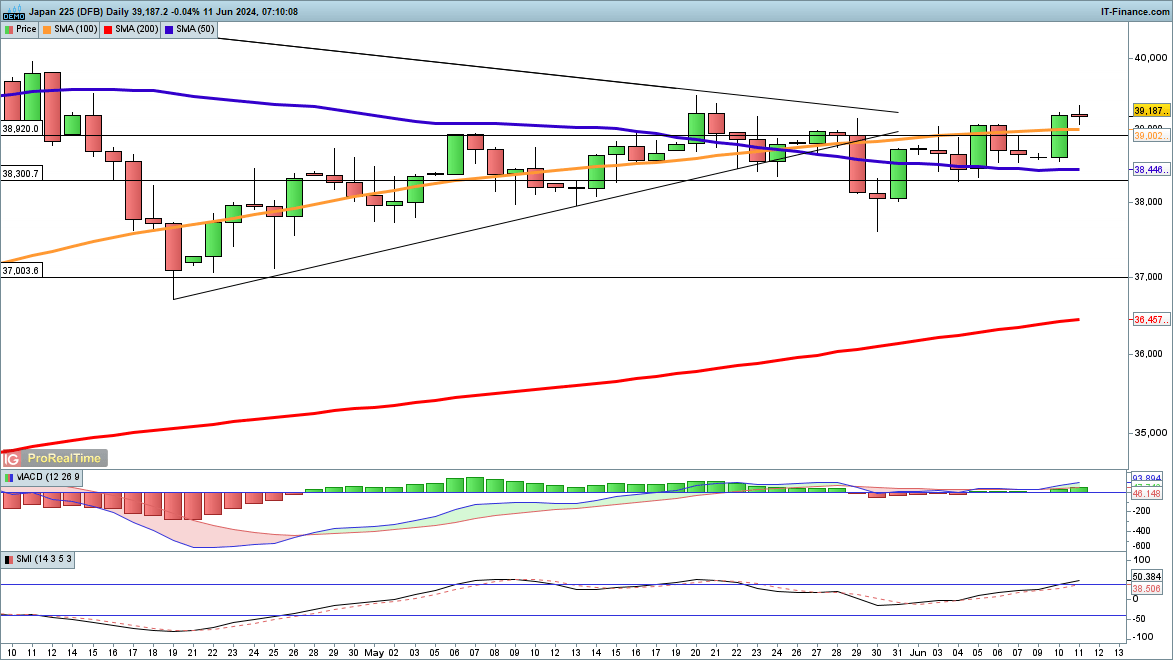
Nikkei 225 testing May highs
The index enjoyed solid gains on Monday, recouping the losses of the second half of last week.In the short-term, a close above 39,477, the 20 May high, would mark a fresh bullish development, and potentially spark a move back towards the March record highs.
A reversal back below the 50-day SMA would be needed to negate this bullish outlook.
Nikkei 225 Daily Chart