


US Dollar Slips Further, Gold Nudges Higher, Bitcoin Poised for a New ATH
US Treasury yields remain in a downtrend and that’s hurting the dollar. Gold continues to recover while Bitcoin eyes a new all-time high.
- US 2-year yields close in on a two-month low.
- Gold continues to recoup recent losses.
- A confirmed break of $72k should see Bitcoin post a new ATH.

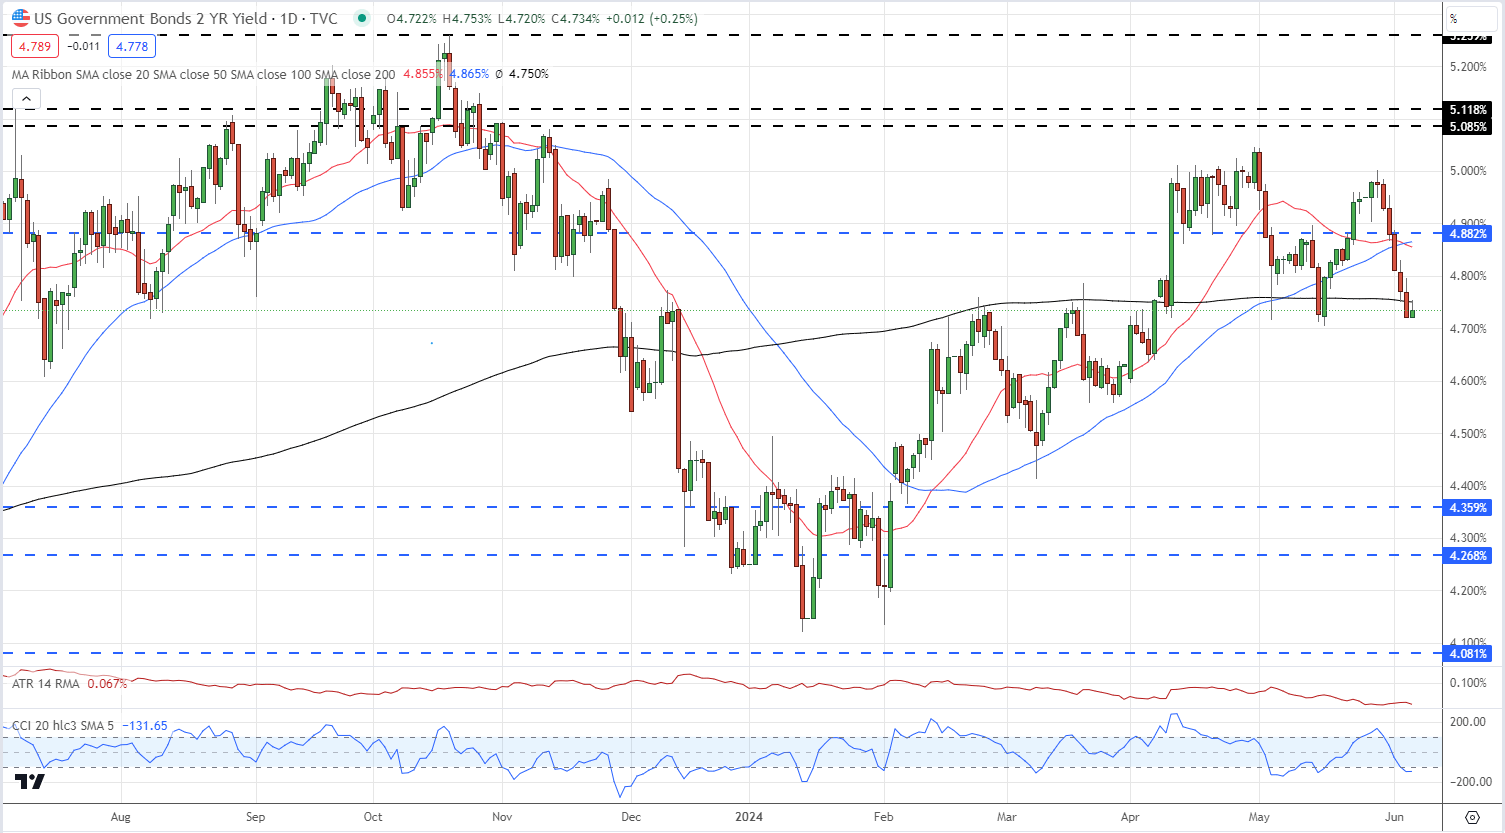
The yield on the US 2-year government is within a couple of basis points of posting a new two-month low and is dragging the US dollar lower. The recent double-high at 5.05% seems likely to be this cycle’s high, unless the Fed takes an unexpected hawkish turn, and further losses are expected over the next few weeks sheds of the Fed’s first rate cut. Six red candles in a row have pushed two-year yields into oversold territory so a small retrace higher may occur before the sell-off resumes.
US 2-Year Yields
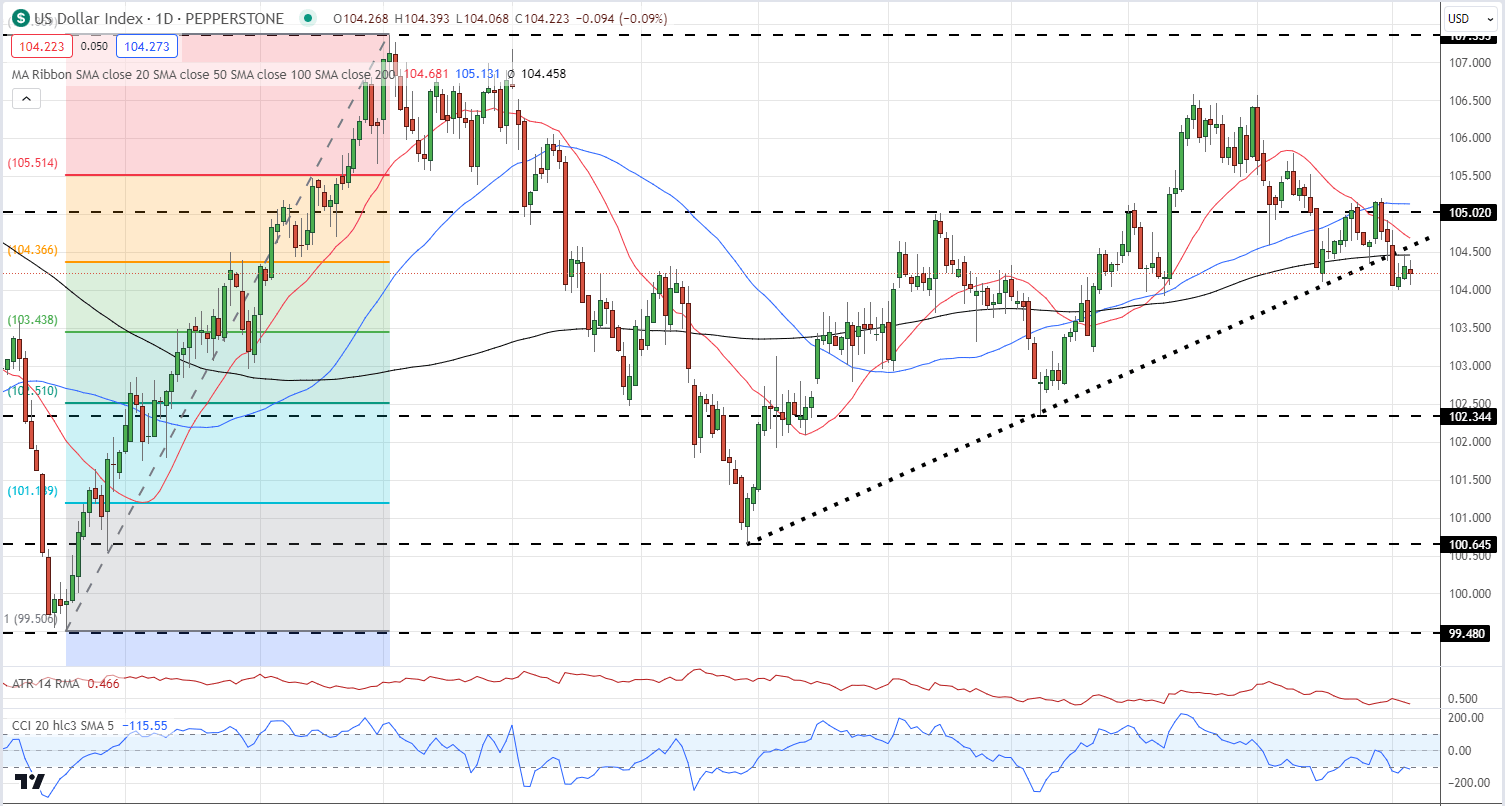
The dollar index is also looking under pressure and now trades below the 200-day simple moving average, the 38.2% Fibonacci retracement level, and recent trend support. Friday’s US Jobs Report has the ability to send the greenback higher in the short-term, but in the medium-term, the dollar index may drift down to the 50% Fib retracement at 103.44 before testing the early March swing-low at 102.34. The US dollar index is also in oversold territory so a period of consolidation is needed before the next move lower.
US Dollar Index Daily Chart
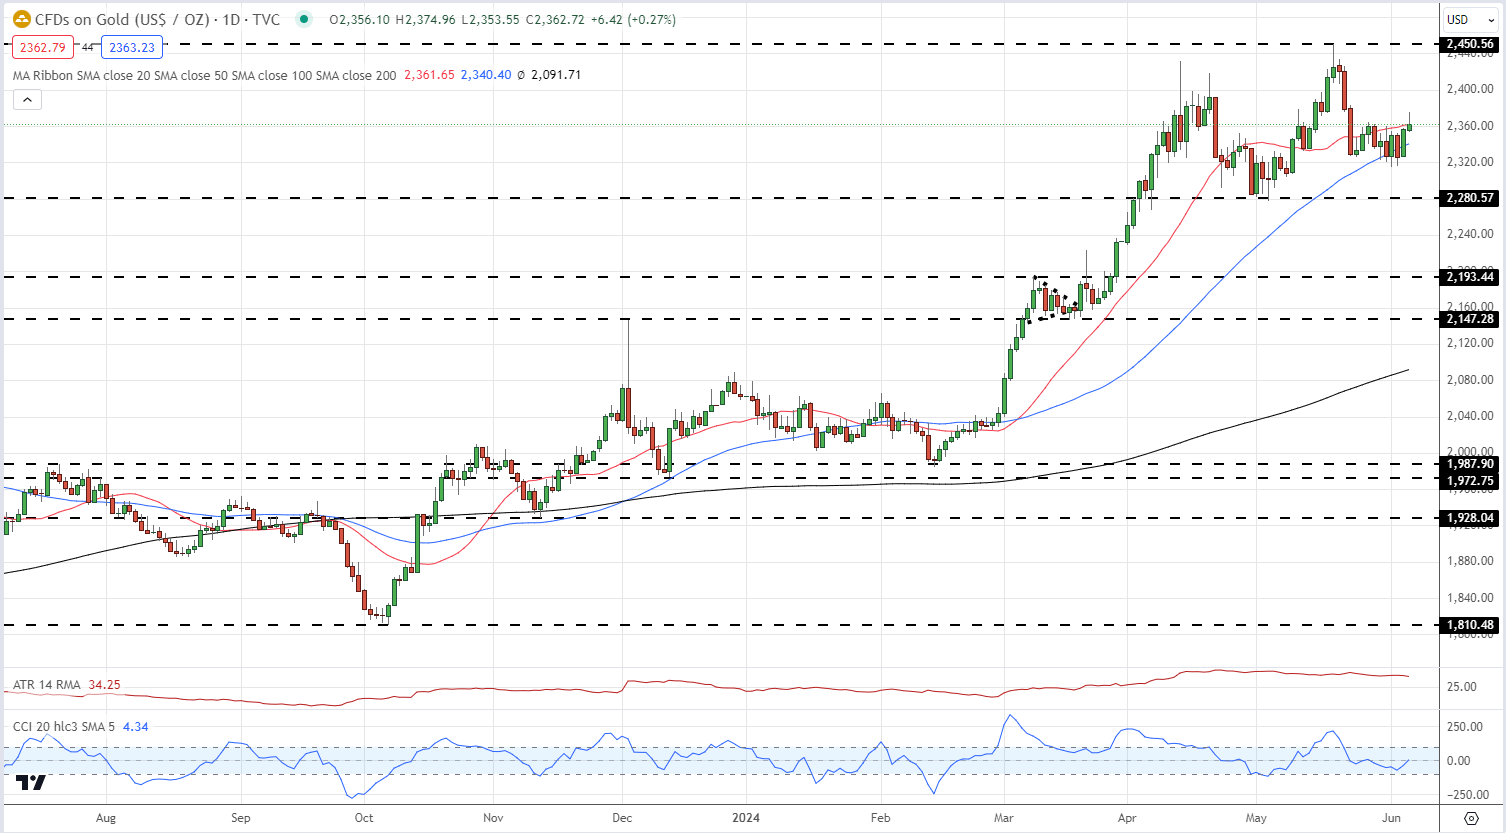
Gold is re-testing the $2,360/oz. level and a break above here would see the precious metal above the last simple moving average, adding credence to a further move higher. The recent $2,280/oz. - $2,450/oz. range should hold in the short- to medium-term.
Gold Daily Price Chart

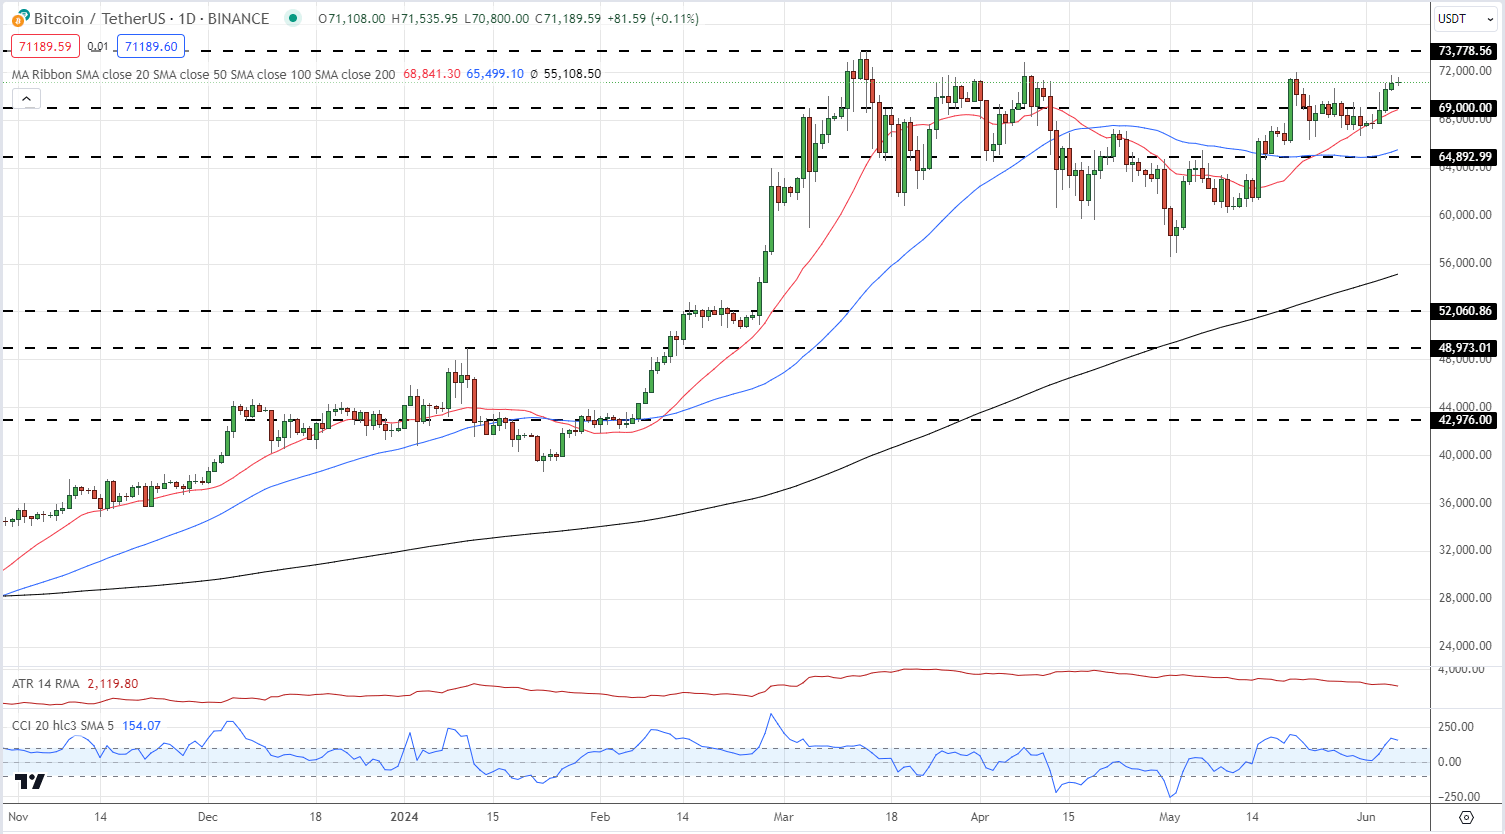
Bitcoin is closing in on the important $72k level, aided by further heavy spot ETF purchase. In the last two sessions alone, spot ETF providers have bought around $1.37 billion of Bitcoin, dwarfing the 450 Bitcoin now mined daily.
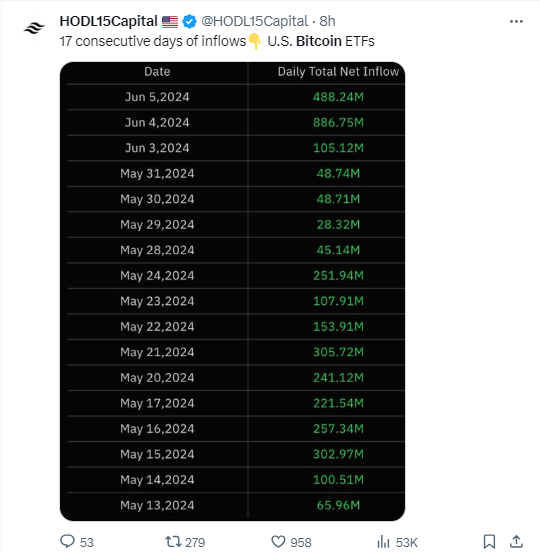
A break and open above $72k leaves the $73,778 ATH vulnerable.
Bitcoin Daily Price Chart
All Charts by TradingView
What are your views on the US Dollar, Gold and Bitcoin – bullish or bearish?? You can let us know via the form at the end of this piece or you can contact the author via Twitter @nickcawley1.


