


Dow, Dollar, Gold Talking Points:
- Risk aversion was on full display this past session with a range of speculatively driven assets – like the SPX, DAX, crude and carry – registering significant losses
- Recognition that US stimulus is on ice is folding into proactive concern around global Covid cases with anticipation building for key event risk like the US elections
- While the November 3rd vote is the highest profile docket item, the US GDP and FAANG earnings Thursday are potent sparks – as are the ECB and BOJ decision and more
Risk Trends Take a Broad and Urgent Tumble
Markets took a troubling turn for the worst this past session. The sudden slump took many – myself included – by surprise. With the US Presidential election less than six days away, anticipation is an increasingly powerful force on not just the US, but the global financial markets. That would insinuate that gaining traction on anything speculative oriented would likely be very difficult. However, when it comes to extreme emotions, fear is always more powerful than greed. The question this remarkable development raises is whether there is a trend at hand or if this is just the personification of exaggerated volatility with limited outlet. For benchmarks, the blue-chip Dow Jones Industrial Average took top spot on my radar, with a gap lower to start the day (taking out the 100-day moving average and trendline support in the effort) with continued selling that pulled us below the technical ‘correction’ designation below the 10 percent off highs mark. The tech-laden Nasdaq slipped its own threshold while the S&P 500 is still treading above that water line.
| Change in | Longs | Shorts | OI |
| Daily | -18% | 18% | 7% |
| Weekly | -19% | 14% | 4% |
Chart of Dow Jones Industrial Average with 50, 100-Day Moving Averages and 1-Day Range (Daily)
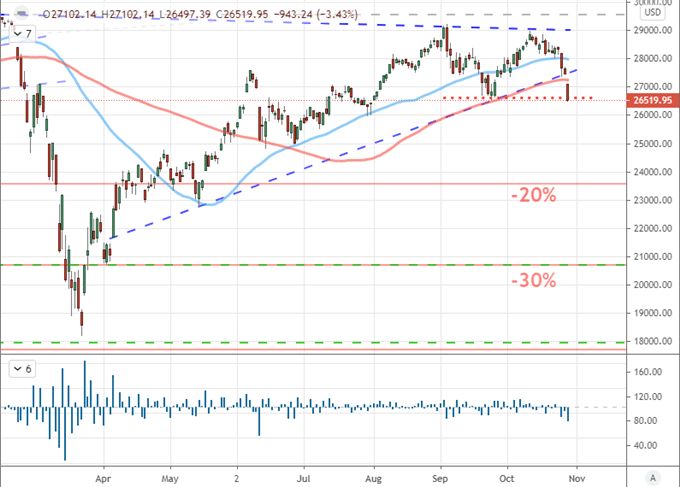
Chart Created on Tradingview Platform
Taking a closer look at the Dow, the potential for follow through should be looked upon with a healthy dose of skepticism. Yet, the check against a full-tilt collapse draws very different views. On the one hand, there are those with the basic mentality that any and all slips are opportunities to ‘buy the dip’. That is a short-sighted assumption in my view. Alternatively, the anticipation of next week’s Presidential election is a powerful moderator of conviction. This can lead to probabilistic assumptions of mean reversion. What are retail CFD traders assuming in the IGCS numbers below? I think it is more of the former as long interest hits the highest levels seen in at least a few years.
| Change in | Longs | Shorts | OI |
| Daily | -18% | 18% | 7% |
| Weekly | -19% | 14% | 4% |
Chart of Dow Index with IG Retail CFD Positioning (Daily)
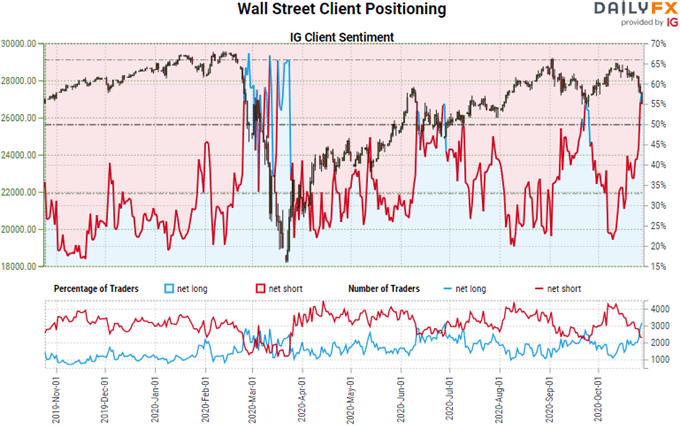
Chart Created by DailyFX with Data from IG
As for the depth charts on risk aversion, Tuesday’s slump was even more comprehensive than it was intense. Global equity indices, emerging markets, junk assets, commodities with a risk bent and carry trade were all in retreat. What’s more, the drop was intense enough that there was little mistaking the sense of trouble in any of these nodes. Breadth and depth its my preferred measure of sentiment. This still doesn’t seem a commitment to a full blown bear trend in the financial system, but the elements are all there. Investors shouldn’t be totally dismissive of a self-sustaining risk aversion trend. The impact is too substantial.
Chart of Risk Trend (Bullish or Bearish) Intensity
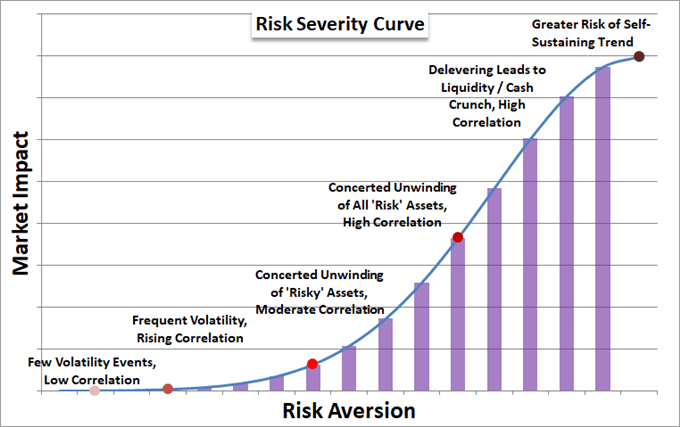
Chart Created on John Kicklighter
Gauging Conviction in Risk Trends to Override Anticipation
In evaluating whether we are seeing sentiment rollover, it is not surprising to see a lot of debate at hand. In my poll asking traders in Twitter what situation we are currently in, there was a close-to-even split between those that felt the bear trend was underway, those that saw this as a temporary dip and further the group that said it all depended on what happened after next Tuesday’s election. The threshold in my view is whether the range of fundamental troubles – Coronavirus return, GDP expectations faltering, stimulus appetites falling apart, etc – are weighty enough to shake out comfortable complacency.
How could US elections impact the markets? Click here to see our aggregate report on the market reaction to election.
Twitter Poll for Whether Risk Trends are Bearish
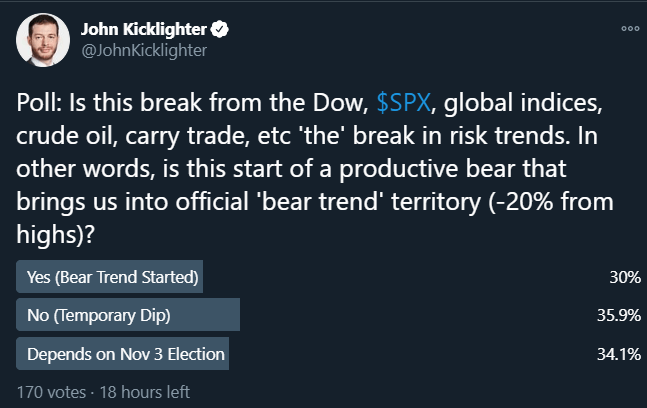
Poll from Twitter.com, @JohnKicklighter
An interesting measure of risk aversion that I would point out form this past session’s broad retreat was a slide in gold prices. The metal is traditionally considered a safe haven, and that role is still valid today. For those that look back to the height of the pandemic slump in March, they would see the commodity took a tumble right along with the S&P 500. The charge through that period was the need for liquidity. Ultimately, gold is a safe haven asset, but it is also a market which investors actively squirrel funds to avoid short-term volatility. When speculative interests swoon deeply, the need for capital to cover margin and simply avoid leverage (thematic as much as financial) can pull the market down.
Chart of Gold with 50 and 100-Day Moving Averages (Daily)
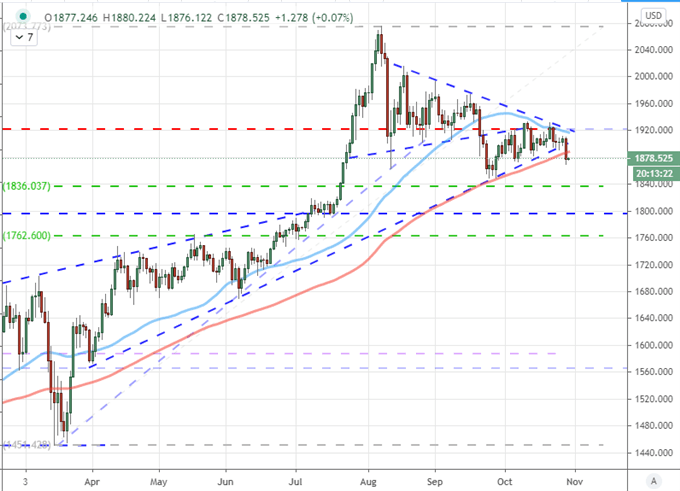
Chart Created on Tradingview Platform
Top Thursday Event Risk: ECB Decision; US GDP and FAANG Earnings
Whether evaluating the conviction in a market-wide risk aversion or a singular benchmark’s chances of turning a belt hold into a bullish reversal, it is imperative to register follow through. Thursday’s session will be critical to signaling where convictions rest. In the meantime, the fundamental sparks will hit a worrying level. Expected to hold some latent – though likely underwhelming – potential for spurring confidence, the European Central Bank (ECB) and Bank of Japan (BOJ) rate decisions on Thursday listings. The former offered little to be truly confident in but the former still has some semblance of sway over market influence. I put more stock into the US 3Q GDP release that is on tap. The forecast for a more than 30 percent recovery in the world’s largest economy may seem incredible and speculative rocket fuel. However, meeting that extreme reading would not offset the losses suffered in the previous quarter. Further, the outlook has taken a material turn for the worst in recent weeks.
Chart of Total GDP and Annualized Quarterly Change (Quarterly)
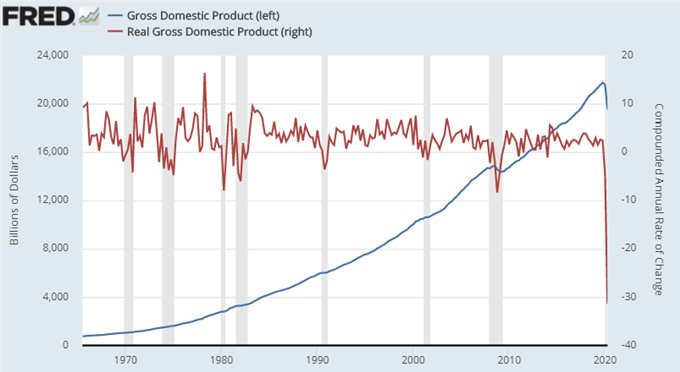
Chart and Data from Federal Reserve Economic Database
Another high level event to mention is the afterhours release of FAANG earnings stats. After the New York close, we are due reports from Facebook, Apple, Amazon and Google. Their collective market cap is enormous, but their symbolic reference to risk trends is perhaps even more exceptional. The expectations are for a sound footing that can continue to defy economic forecasts. That shifts the potential in my perspective where ‘beating expectations’ is particularly difficult to muster while disappointment is a troubling tangible scenario.
Chart of Nadex-S&P 500 Ratio Overlaid with FAANG Index (Daily)
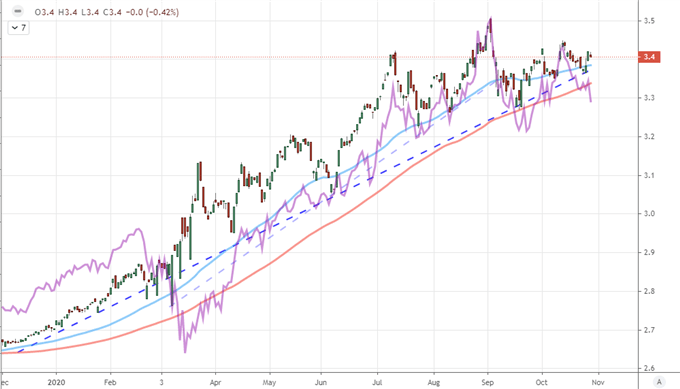
Chart Created on Tradingview Platform

.


