


S&P 500, Dollar, EURUSD, AUDUSD Talking Points:
- Risk trends opened to a critical hit this past week with the likes of the S&P 500 and Dow triggering key breaks but the milestones are even greater ahead
- While the range of systemic fundamental risks is widen open ahead; I will not assume course or intensity from pandemic, growth, geopolitical or other broad matters
- For concentration in event risk, the Dollar’s range including NFPs, consumer confidence and Presidential debate make for a top volatility candidate
Risk Trends Have Aimed Lower but Commitment Still Wanting
This past week opened to a remarkable, bearish progression with a wide range of risk-sensitive assets sliding in solidarity of a ‘risk off’ march. Yet, despite the breadth of the move and an opening overture of conviction, the markets were seemingly not ready to wage a full-scale bear trend. Will we find conviction more amenable in the week ahead? On the technical side, the pattern is the broadly similar; but the S&P 500 remains one of my preferred – though clearly imperfect – one-look benchmarks. The symbolic and practical core of errant speculative appetite closed out its fourth consecutive week’s loss – the longest slide on this scale in 13 months. For milestones, the benchmark will open next week trading between the floor of a six-week head-and-shoulders pattern at 3,320 to the upside and the gravity of a technical ‘correction’ (a 10 percent retreat from highs) at 3,230 below. However, for those watching the chart, perhaps it will be easier to monitor the 50-day and 100-day moving averages which fall roughly on those levels respectively.
| Change in | Longs | Shorts | OI |
| Daily | 1% | -1% | 0% |
| Weekly | 15% | -13% | -1% |
Chart of S&P 500 with 50, 100-Day Moving Average and COT (Daily)
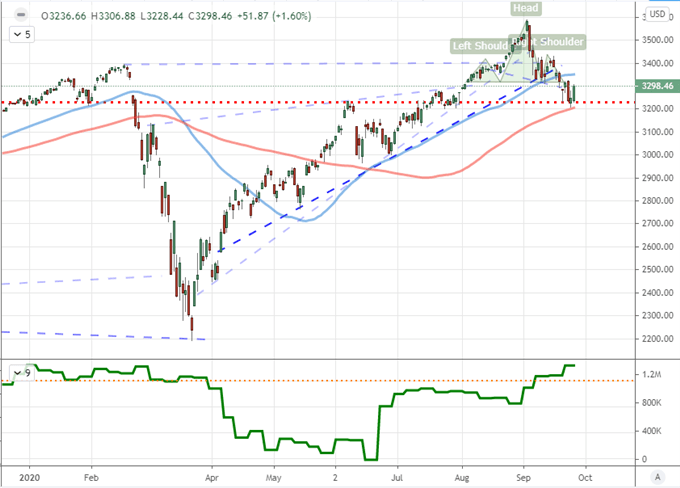
Chart Created on Tradingview Platform
On the fundamental side of things, I’m looking for the motivation that would carry the full weight of speculative conviction into a cascade lower or rouse a systemic rebound. With the US election looming as a potentially all-consuming global event a month forward, there is that familiar sense of inertia that may need to be overcome with something substantial. The pandemic, collective growth views, monetary policy conviction and trade wars are all on the scale that can span the entire financial system. That said, there is little on the docket in the way of data or a general event that projects the heft of leading all investors to trend. That is not to say it cannot happen. Rather, I feel it is better to be vigilant rather than expectant of a particular driver and thereby outcome.
Chart of ‘Risk’ Benchmarks 12-Month Performance (Daily)
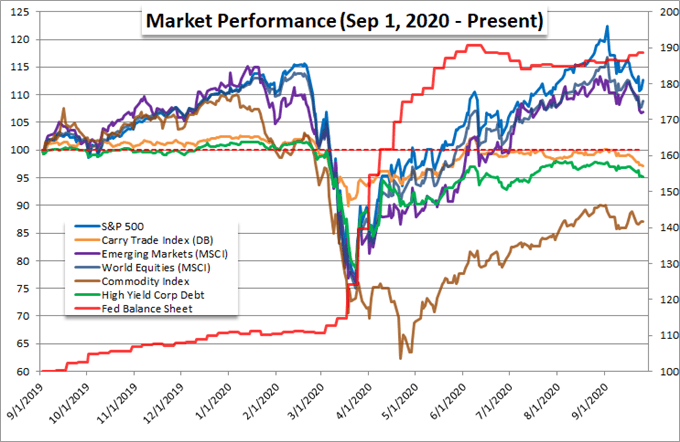
Chart Created by John Kicklighter, Data from Bloomberg
US Event Risk Tops the Week Thereby Dollar is Front of Mind
Looking out over the economic calendar, there is a range of event risk across the world worthy of our attention as traders. Among a few of the more notable highlights, the Chinese PMIs and industrial profits, European Commission special meeting, Eurozone sentiment surveys, Japanese capital expenditures and Australian retail sales carry weight. However, the most potent of the dockets is arguably the United States’ listings. Before we even reach the Friday NFPs (nonfarm payrolls), we will absorb the trade balance, Conference Board consumer confidence survey and ISM manufacturing activity report. Each touches on a grander systemic theme; but the wild card is the first Presidential Debate between President Trump and challenger Former Vice President Joe Biden Tuesday evening.
Chart of the DXY Dollar Index with Net Speculative Futures Positioning (Weekly)
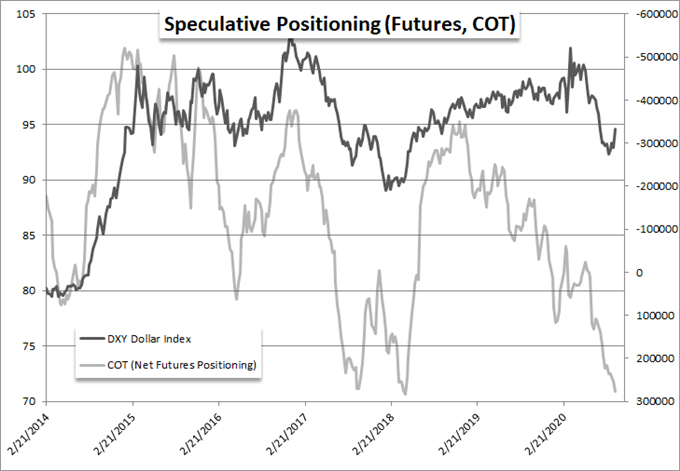
Chart Created by John Kicklighter, Data from Bloomberg
For the Dollar’s general course, this past week presented some meaningful progress following a period of consolidation. As a mirror to the SPX and other risk assets, the Greenback actually initiated a rally to start this past week; but its own momentum carried through more readily. I don’t believe the currency is acting as a straightforward haven. It still harbors the potential but that is a role that arises from extreme circumstances which we as yet are not facing. The many fundamental roles this currency represents makes for a potentially conflicted drive, but the technicals and backdrop positioning can make for a more straightforward interpretation. EURUSD’s break through its head-and-shoulders pattern is a good example of the former while the net speculative futures positioning in all Dollar contracts pushing extreme lows contextualizes the latter.
Chart of EURUSD with 50-Day, 100-Day Moving Averages and 5-Day ROC, COT (Daily)
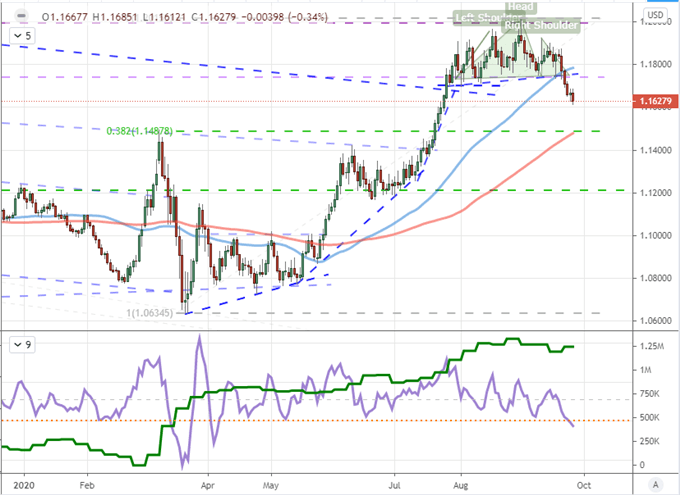
Chart Created on Tradingview Platform
Sentiment Represents its Own Extreme Context
Where the Dollar’s position is stretched by bulls in the speculative futures ran, there is further context that can highlight the forces that can swell or capitulate with significant consequence ahead. EURUSD for example reflects a similar phenomenon as the aggregate Dollar net futures figures. While it has come off somewhat, the net long positioning among speculative interests is just off its record – a significant stretch beyond the previous peak in exposure three years ago. Meanwhile, retail traders that average a much shorter holding intent is showing an unexpected bearing in support of a net short perspective. That is truly unusual for a group that actively fights the development of new trends (a polite way of saying ‘they often attempt to pick tops and bottoms’).
| Change in | Longs | Shorts | OI |
| Daily | -1% | -4% | -3% |
| Weekly | 4% | -10% | -5% |
Chart of EURUSD with Net Speculative Futures Positioning (Weekly)
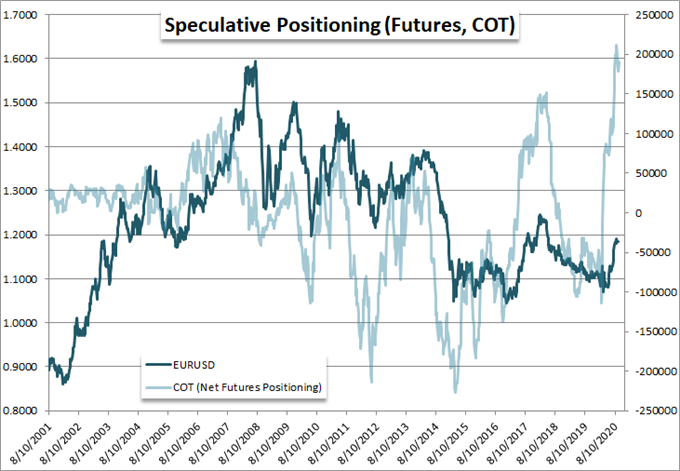
Chart Created by John Kicklighter, Data from Bloomberg
Another Dollar pair that has been frequent on my radar is AUDUSD. The pair notched a six consecutive day drop, but it was the week’s overall progress in its slide that was perhaps earnestly impressive – when markets position for reversion it is usually born of pace rather than statistic persistence. The 100-day moving average will be immediate support to test as the new weeks open and there is more than a little connection to risk trends from this pair.
Chart of AUDUSD with 50-Day, 100-Day Mov Avg and COT, Consecutive, 5-Day ROC (Daily)
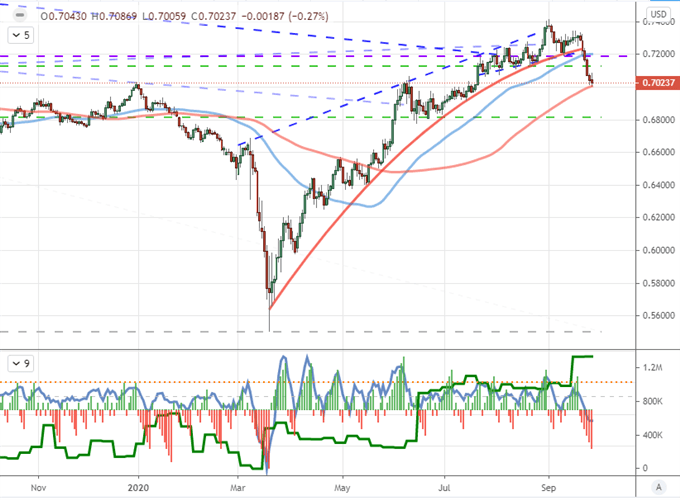
Chart Created on Tradingview Platform
In further contrast to EURUSD, retail interests are showing their more standard colors in a shift to ‘buy the dip’ in the IG Client Sentiment statistics. Retail traders covered in this group flipped net long this past week for the first time in 5 months. Previous months of congestion and the 100-day moving average as support is likely offering some level of confidence in the move; but the fundamental backdrop for the pair makes this a much riskier endeavor.
| Change in | Longs | Shorts | OI |
| Daily | 2% | 3% | 2% |
| Weekly | 29% | -46% | 0% |
Chart of AUDUSD with Retail Net Speculative Positioning from IG (4-Hour)
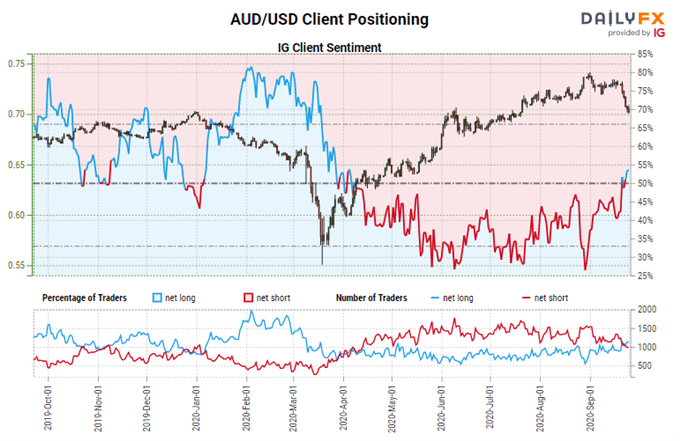
Chart from DailyFX.com

If you want to download my Manic-Crisis calendar, you can find the updated file here.
.


