


EURUSD, AUDUSD and S&P 500 Talking Points:
- Risk appetite trends not only spun their tires through the S&P 500 and other benchmark for direction, but volatility started to ebb this past session
- Meanwhile, the Dollar’s rally seemed to loose momentum as Powell spoke, counter currencies absorbed fundamentals and stimulus expectations sputtered
- AUDUSD seems to show retail traders positioning for a ‘buy the dip’ perspective while EURUSD seems to draw more conviction
The Dollar’s Charge is One of the Last Prominent Trends and Its Tempo is Still Fading
The drive behind traditional ‘risk trends’ – which I like to measure through benchmarks like the US indices – was already struggling for conviction earlier this week. Through this wobble, however, the Greenback seemed to be keeping its tempo. That is until this past session. On a close-over-close basis, the trade-weighted DXY Dollar Index would fall short of a its fifth consecutive bullish daily performance, though that hasn’t yet manifest in a significant technical correction. With Fed Chair Jerome Powell ending his run of testimony without a course change and the latest efforts by Democratic leaders to muster a $2.4 trillion stimulus program steeped in skepticism, EURUSD put in for a doji Thursday. While not fully convincing for a turn, it does take the wind out of the sails for a market that was attempting to defy a moderated trend elsewhere.
Chart of EURUSD with 50-Day, 100-Day Moving Averages and 4-Day ROC (Daily)
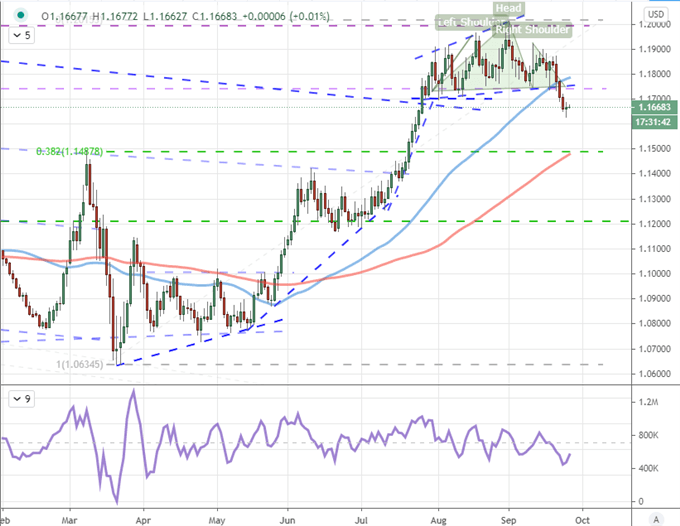
Chart Created on Tradingview Platform
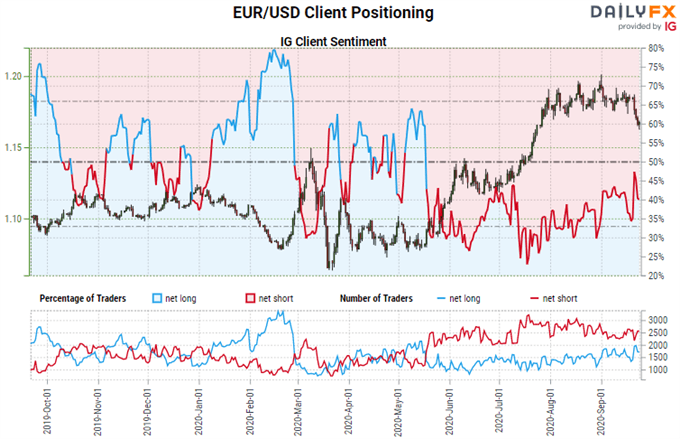
Meanwhile, while price action would signal hesitation from the world’s most liquid exchange rate, retail positioning seemed to show the pressure was still very much in place. From the slower adapting Commitment of Traders (COT) net speculative futures positioning numbers, EURUSD exposure is still very close to its record net long established at the end of last month. Yet, the timely retail positioning from our IGCS signaled trades were making more of an effort to commit to the breakdown that has taken root this past week. Of course, this may not rouse a great wave of interest relative to an otherwise anchored market; but the bearings are still in place.
| Change in | Longs | Shorts | OI |
| Daily | -1% | -4% | -3% |
| Weekly | 4% | -10% | -5% |
Chart of EURUSD with Retail Net Speculative Positioning from IG (4-Hour)
In technical terms, the AUDUSD looks very similar to EURUSD. The Dollar-driven pair broke its own ‘neckline’ on an exaggerated head-and-shoulders pattern developed over the past two months that happened to fall closely to the 50-day moving average around 0.72. Its own drop would extend to a fifth day, but the progress through this most recent session was notably more staid. The 100-day moving average near 0.70 is nonetheless a looming milestone
Chart of AUDUSD with 50-Day and 100-Day Moving Averages with 5-Day ROC (Daily)
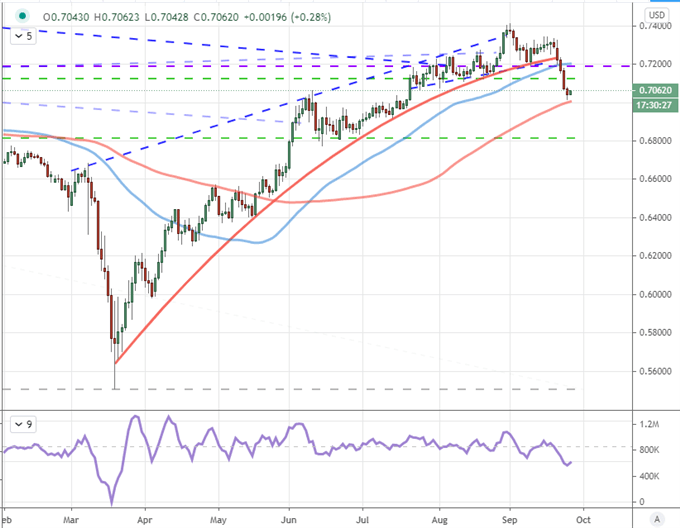
Chart Created on Tradingview Platform
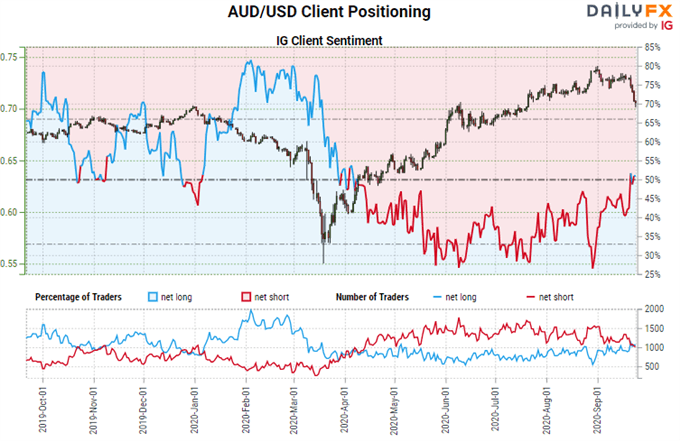
Yet, where the charts between EURUSD and AUDUSD look fairly similar, there is a meaningful disparity in speculative appetites. Looking at the IGCS for the latter pair, there seems less effort to ‘buy the dip’ as net positioning hovers above the 50/50 balance through this past session. There is some fundamental difference between these pairs such as Europe’s efforts to warn of its economic travails, but the most noteworthy in my book is the greater risk-trend sensitivity for AUDUSD. I won’t construe this as a leading signal to the likes of global indices, but it does raise interesting questions as to what themes are most influential when processed through the Dollar.
| Change in | Longs | Shorts | OI |
| Daily | 2% | 3% | 2% |
| Weekly | 29% | -46% | 0% |
Chart of AUDUSD with Retail Net Speculative Positioning from IG (4-Hour)
Risk Trends Remain One Step Away from Something Critical
For scale and scope, there is nothing quite as influential for the market as the undercurrent in risk trends. Correlation is still tangible across the different measures of speculative intent, but pace is noticeably tamed. Nevertheless, looking at a milestone like the S&P 500, the potential for renewed arousal is unmistakable. The benchmark has held the line at its 100-day moving average that happens to coincide with a psychological level in 3,200. However, I see the floating level of the ’10 percent retracement from record highs’ which would be a technical ‘correction’ as loaded catalyst. Markets are roused by the attention and action of the masses, and such a milestone – if passed – would not go unnoticed by the headlines.
| Change in | Longs | Shorts | OI |
| Daily | 1% | -1% | 0% |
| Weekly | 15% | -13% | -1% |
Chart of S&P 500 with 50, 100-Day Moving Average and COT, 100DMA Disparity (Daily)
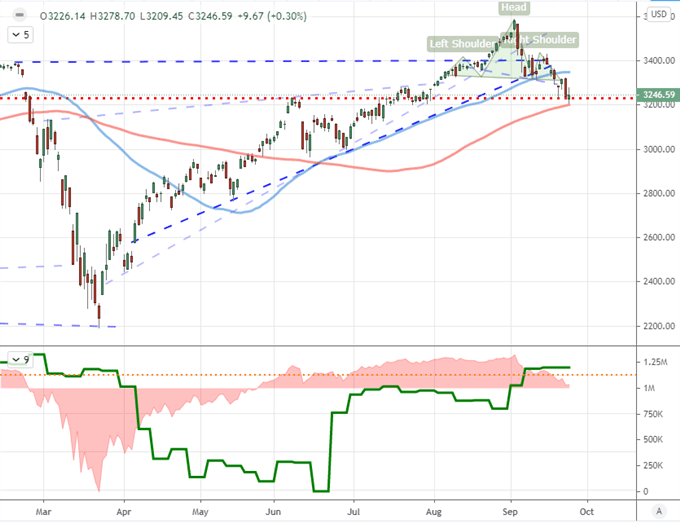
Chart Created on Tradingview Platform
The Fundamental Drum Beats Traders Should Monitor
For fundamental drivers, the resurgence in the cases of the coronavirus in Europe and the tension through political instability in the United States remain two notable flashpoints, though neither seemed to be active as of this past session. A more tangible factor seemed to be global monetary policy. Fed Chair Jerome Powell restated concerns in his third day of testimony and called again for fiscal stimulus – to compensate for the central bank’s flagging options. Meanwhile, the BOE Governor Andrew Bailey reflected on the concerns centered on the revival in Covid spread in the UK with a warning of a possible fallout while the ECB’s economic bulletin enforced the need for continued support.
Read more on how central banks impact the forex market in the DailyFX Education section.
Chart of Major Central Banks’ Balance Sheets and Agg 6-Month Rate of Change (Monthly)
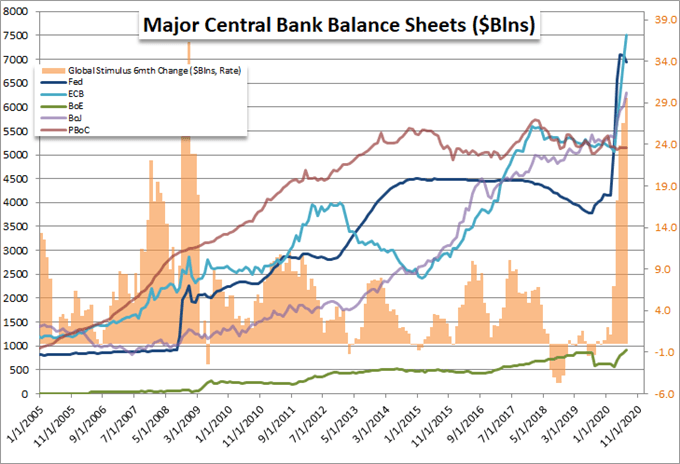
Chart Created by John Kicklighter with Data from Bloomberg Terminal
Among the central bank rate decisions that actually took place this past session, the Swiss National Bank’s (SNB) inactions paired with familiar threats roused little concern from the likes of EURCHF. The Norges bank – another group beholden to the actions of the ECB – delayed its own normalization of monetary policy. The action was reserved for the Mexican Central Bank which actually cut rates by another 25 basis points (0.25 percent). This reduction however was the smallest cut since February, which some market participants took as a cue that the run could be nearing its end – hence the USDMXN slip.
Chart of USDMXN with 100-Day Moving Average and 4-Day Rate of Change (Daily)
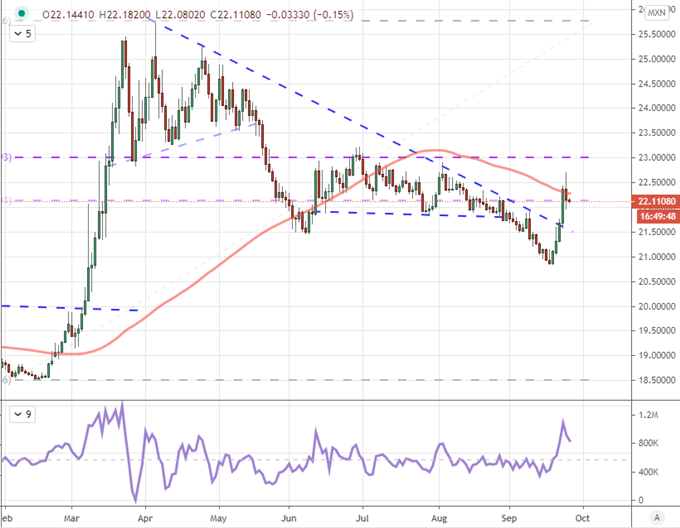
Chart from Google with Data from Wikipedia

If you want to download my Manic-Crisis calendar, you can find the updated file here.
.


