


S&P 500, VEU, Dollar, EURUSD, AUDUSD Talking Points:
- Markets started this week with a broad and palpable technical break towards risk aversion, but follow through ebbed this past session
- While risk assets were showing indecision after a critical charting event, the Dollar took the opportunity to forge its own bullish break
- Top theme ahead is born of the major economies’ September PMIs for a growth perspective, but don’t overweight the catalyst relative to the current
Risk Aversion Stumbles Out of the Gate
We started this week off with a critical technical shift. Not only did the S&P 500 and Dow Jones Industrial Average move to reinforce a serious technical breakdown from a weeks-long head-and-shoulders pattern, there was a remarkably broad downdraft in ‘risk-leaning’ assets. From a charts perspective, the fire was lit and bears had the green light to take the yoke. And yet, the day after the break was made, momentum was tripped up out of the gate. Falling back to my preferred, imperfect one-look read on sentiment; the US equity index capitalized on the doji breakdown and spent the past session rising back up to meet former support to give it weight as novel resistance. Will it play a role in hesitation or even stand as the staging area for the next leg lower? Only conviction will bear that out.
Read about the head-and-shoulders pattern along with other major technical patterns in our education section.
| Change in | Longs | Shorts | OI |
| Daily | 1% | -1% | 0% |
| Weekly | 15% | -13% | -1% |
Chart of S&P 500 with 50-Day Moving Average, Daily Gaps and 7-Day Rate of Change (Daily)
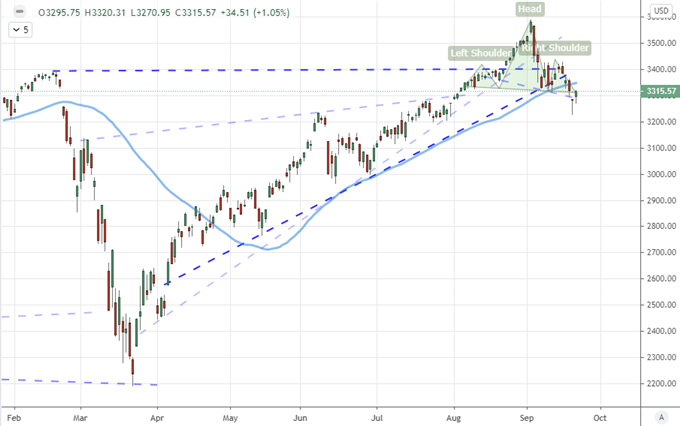
Chart Created on Tradingview Platform
Looking more broadly for a picture of general sentiment, there remains a notable lean towards more productive (or destructive, depending on your perspective) risk aversion. The German DAX, UK FTSE 100 and Nikkei 225 were all struggling through this past session. That was encompassed in the ‘rest of world’ equity ETF, the VEU, which was actively traded during the New York session but only put in for a second doji Tuesday – making no effort to fill the week-opening bearish gap. Emerging market, high yield, carry and risk-sensitive commodity assets are all in a similar boat. Making a half-hearted – thus far – effort to ward off a more material breakdown.
Chart of NDX to SPX Ratio with 50 and 100-Day Moving Averages and 1-Day ROC (Daily)
Chart Created on Tradingview Platform
Naturally, hesitation after an otherwise prominent technical break will feed a familiar sense of ‘buy the dip’ among the diehard bullish gap. We could also view this as a range-based view, but the risk/reward dynamics of such a perspective after seeing key technical levels give across a wide berth of assets is materially distorted. Nevertheless, the final results from my Monday poll asking whether the week’s actions thus far represented a shift in favor of the bears or another dip-buying situation finds a fairly close 57 to 43 percent split.
Poll from Twitter on Whether Markets Have Shifted to Bearish Trend
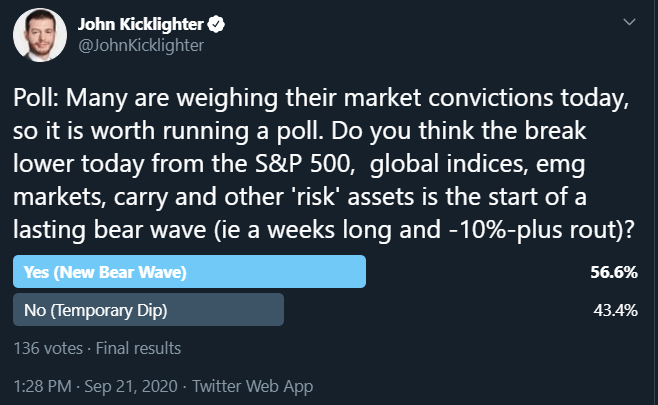
Poll from Twitter.com, @JohnKicklighter
Dollar Puts in for Its Own Break…But Does it Do So as a Safe Haven?
As traction starts to slip on risk-leaning assets, the Dollar seemed to think it a good time to post its own bullish breakout. The DXY Dollar Index cleared its 50-day moving average and the inverse head-and-shoulders ‘neckline’ at approximately 93.60 That seems to have the hallmarks of a break. However, a break and a trend are two very different scenarios. Follow through requires some conviction – even if suspect from a practicality perspective – and there is reason to remain cautious on the Greenbank’s intentions. Risk aversion could rouse the Dollar to action, but it would take a serious charge. Alternatively, steady deteriorating in the pandemic status and economic potential of US counterparts could leverage the country’s appeal – along with its currency. Perhaps the PMI data today will raise this contrast.
Chart of Severity in Risk On / Risk Off
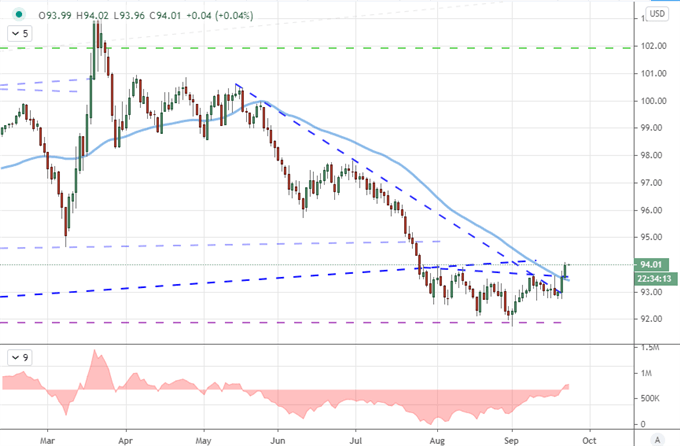
Chart Created by John Kicklighter
Among the majors, the EURUSD’s slide below 1.1725 was a remarkable development. The head-and-shoulders structure with its break were as clean as they come. That said, chart patterns are ‘in the eye of the beholder’, so intent should be extrapolated from a textbook interpretation of such moves. Nevertheless, retail traders were impressed by the development. Retail FX positioning at IG showed a drop in short-term short positions and swell in longs. Net speculative position is as close to flipping net long as it has been since the first half of May.
| Change in | Longs | Shorts | OI |
| Daily | -1% | -4% | -3% |
| Weekly | 4% | -10% | -5% |
Chart of EURUSD with Net Speculative IG Retail Positioning (4hr)
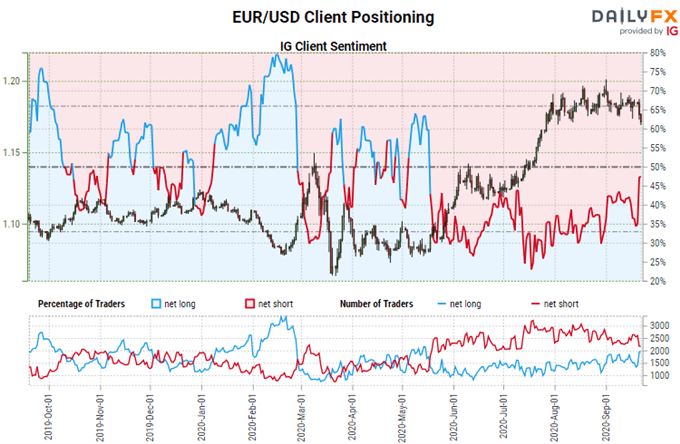
Chart Created on DailyFX.com
Another Dollar pair worthy of our review – really the whole USD suite is interesting – was AUDUSD. This cross slipped its own 50-day moving average as support (after 109 days above) and seems to stare down a significant reversal risk. That said, there has bene multiple months’ worth of congestion which make a decisive break more difficult to trigger. Nevertheless, net retail positioning at IG did flip long for the first time in five months.
| Change in | Longs | Shorts | OI |
| Daily | -1% | -4% | -3% |
| Weekly | 4% | -10% | -5% |
Chart of AUDUSD with Net Speculative IG Retail Positioning (4hr)
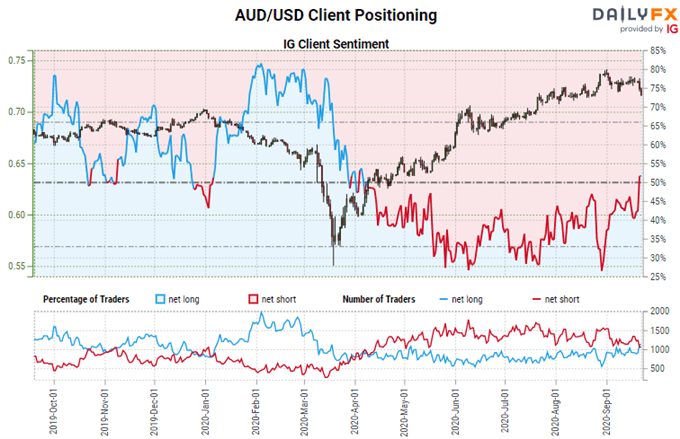
Chart Created on DailyFX.com
The Fundamental Themes that Can Keep Volatility Charged
If you are looking for a deeper motivation than just a grassroots greed or fear cascading into euphoria or panic, there are a host of fundamental issues I’m following. Political risks around the US election and its drawn out count are a significant source of anticipated volatility according to the implied volatility curve. A more immediate pressure is the rise of the pandemic numbers. Worldwide cases have risen these past weeks with certain hotspots like the UK contemplating a return to (economically) drastic actions. Could this snuff out the natural economic recovery and force the need of fresh stimulus backup?
Graph of UK Coronavirus Cases (Daily)
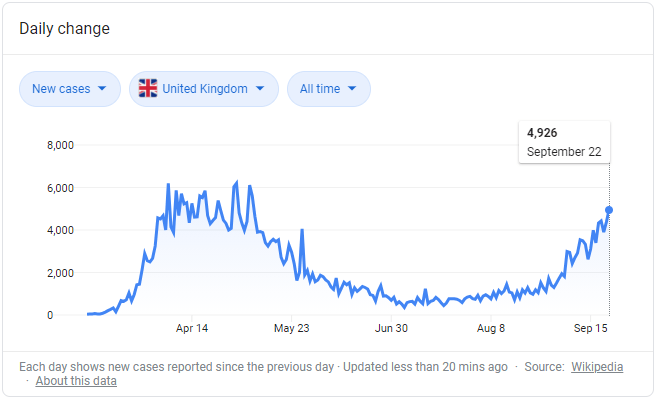
Chart from Google with Data from Wikipedia
A more convenient fundamental scenario – for the fact that it is clearly timed through event risk and has a binary tendency – is the outlook for the major economies’ health. Wednesday brings the September PMIs for Japan, Australia, the Eurozone, the United Kingdom and the United States. If the data is uniformly supportive of the slow recovery, it is likely to render less of an impact given the growing skepticism and warning in forward projections. Alternatively, a downdraft could urge more of a panic response given a stalled recovery before a second wave even truly set in.
Chart of Global PMIs (Monthly)
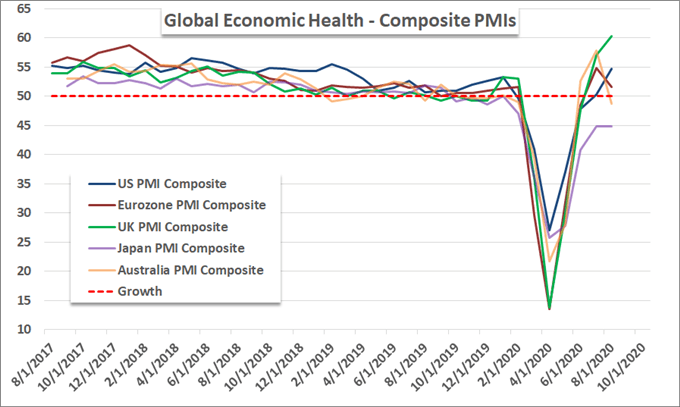
Chart Created by John Kicklighter with Data from Bloomberg Terminal

If you want to download my Manic-Crisis calendar, you can find the updated file here.
.


