


Nasdaq, S&P 500, Dollar and Gold Talking Points:
- The Nasdaq 100 suffer an incredible -5.8% drop Thursday for the biggest drop since March 16th led by tech darlings like Tesla, Amazon and Apple
- While other US and some European indices joined the slide, other risk benchmarks were more reserved in their slide
- Though this past session’s volatility raises the prospect of a full shift in liquidity along with trend, seasonal restraint is still a factor – will Friday NFPs help tip the scale?
A Bout of Sharp Risk Aversion or Genuine Panic?
Even the most aloof speculative squatter would have missed the risk aversion that swept in on the markets this past session. Speculative fallout began at the very peak of the risk spectrum Thursday with US indices suffering a broad and oppressive rout. With the favorite tech names (Apple, Amazon, Tesla, etc) posting the most intense losses, it was clear that markets were being upended. For the Nasdaq 100, a particularly acute -5.8 percent tumble suggested sentiment was collapsing under its own weight. The inexperienced, speculative crowd has pursued this particular area of the market more than any other – an appetite that has not only pushed NDX to its own record high but further a record relative to even its close compatriots in the S&P 500, the Dow Jones Industrial Average and certainly only global benchmarks. The real question is whether this tumble is the beginning of a cleansing fire that sweeps through the system or a quick flash in the pan.
Learn more about the three types of general Forex market analysis in our education section.
| Change in | Longs | Shorts | OI |
| Daily | 1% | -1% | 0% |
| Weekly | 15% | -13% | -1% |
Chart of Nasdaq 100 with 50-Day Moving Average, 1-Day ROC and Gaps (Daily)
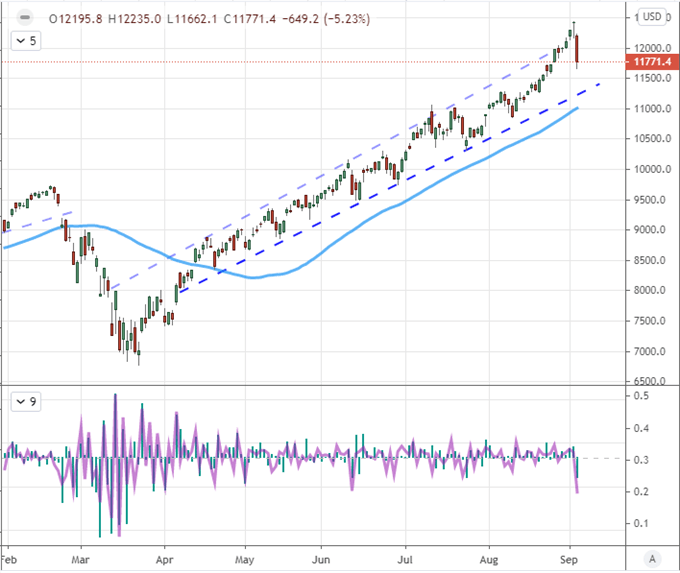
Chart Created on Tradingview Platform
It is worth noting that the pressure was not simply isolated to the very pinnacle of risk favored assets. It would otherwise be easy to discount the slump. Both the broader S&P 500 and diversified Dow Jones Industrial Average would suffer their own acute losses (-3.5% and -2.8% respectively). Technical stance for the former is particularly influential with the former record range high aligning to trendline support dating back to the pandemic selloff low. While attention may skew towards the intensity of this past session’s tumble, even a general bear like myself should acknowledge that this is still a tentative move. We are only one day removed from a record high. There remains material technical support below. And, there isn’t an unstoppable inertia across the financial system that can override the seasonal liquidity drain associated to this period. Don’t forget about the ‘summer doldrums’ which we are still move away from.
Chart of S&P 500 with 20-Day Moving Average and VIX Volatility Index in Red (Daily)
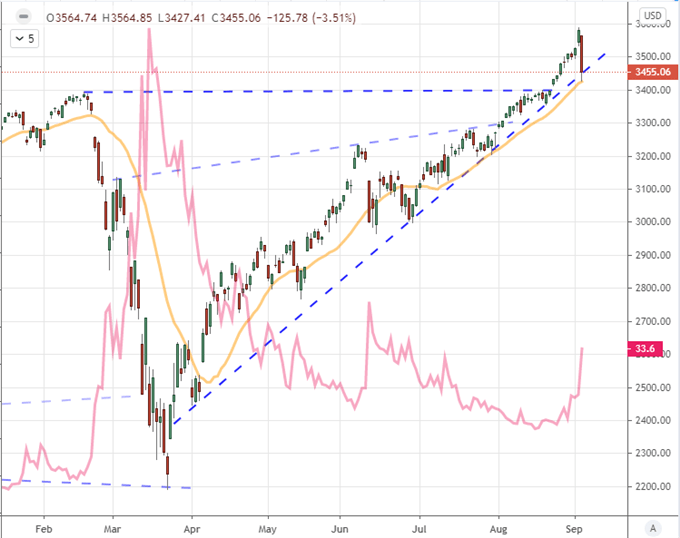
Chart Created on Tradingview Platform
The Quality of Risk Aversion
Whether or not we have catalyzed a self-immolating sentiment reversal depends significantly on the quality of the market’s motivations. I have pointed out many times before that there has been a focused reach for risk among market participants over the past months and years which has prized momentum over ‘value’. That is the genesis behind my Nasdaq-S&P 500 ratio (and S&P 500-VEU ratio). A vogue and extreme version of this concentrated speculative appetite can be seen in Google finance news search trends over the past month. Despite the fact that world’s largest economy entered its deepest recession on record since the Great Depression and has yet to recovery, there was greater search traffic in ‘Tesla’ than ‘Recession’. That can keep the market’s advancing, but it can also stage a fire should the spark catch.
Chart of Google Search Ranking for ‘Tesla’ and ‘Recession’ (Weekly)
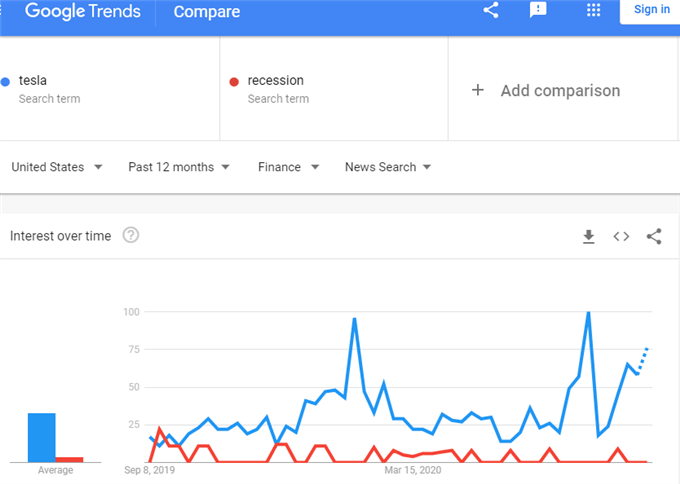
Chart from Google Trends
Putting this abstract sense of risk trend into graphical form, I would qualify that there was certainly an acute risk aversion this past session that would put us at risk of a self-sustaining cycle that ushers in a deep deleveraging. That said, we are not there just yet. Only one day off a record high and with a norm of thin liquidity normal of the early days of September, we may just be in the period of artificially amplified conditions typical of low volume – there is a reason September is the only calendar month that averages a loss for the S&P 500. Nevertheless, traders should take note. These are the kind of tumbles that can readily turn into avalanches.
Chart of Risk Trend Intensity
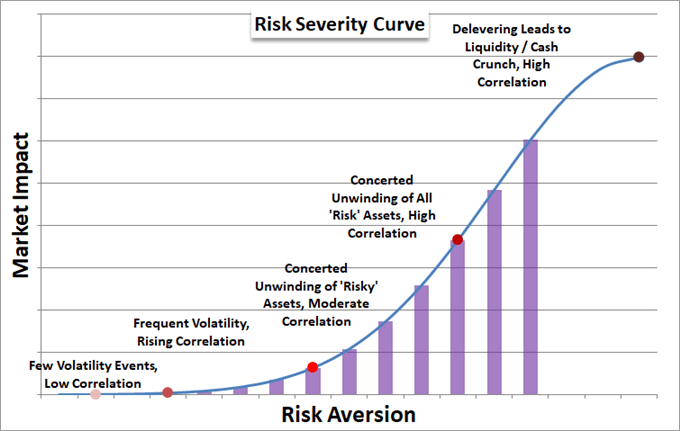
Chart Created by John Kicklighter
The Fundamental Catalysts
As we look ahead, we are just hours away from the start of an extended holiday weekend in the United States. This known drain had led to a cap in activity globally for many years – though it is not a certain curb. Systemically-important event risk can work against the expectations of quiet. This past session, there were more than a few economic health-oriented updates that were unflattering. The ISM service sector survey was top listing and it slipped faster than expected. That is a distinct reminder that the ‘V-shaped’ recovery is the outlier outcome for which the market has perhaps assumed would too much certainty. In similar terms, the initial jobless claims seemed to offer the veneer of a positive outcome, but the sub-one million reading was more the productive of new calculations. The total number of unemployment benefit requests actually rose to above 29 million in August. That should keep our attention for Friday’s NFPs.
Chart of S&P 500 with Manufacturing and Services ISM Surveys (Monthly)
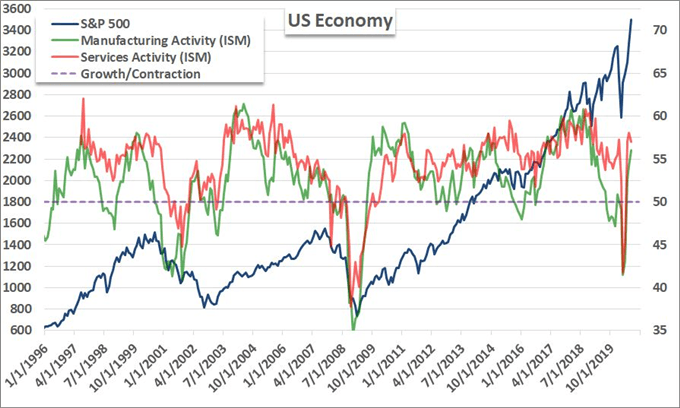
Chart Created by John Kicklighter
Speaking of scheduled event risk, the US employment report is no doubt the week’s final session’s top event risk. There is no guarantee that this event will converge with the second most intensive update (the Canadian jobs report), but the potential is certainly acute. As such, I will be watching USDCAD closely for its potency Friday.
Chart of USDCAD with 50-Day Moving Average and COT Speculative Positioning (Daily)
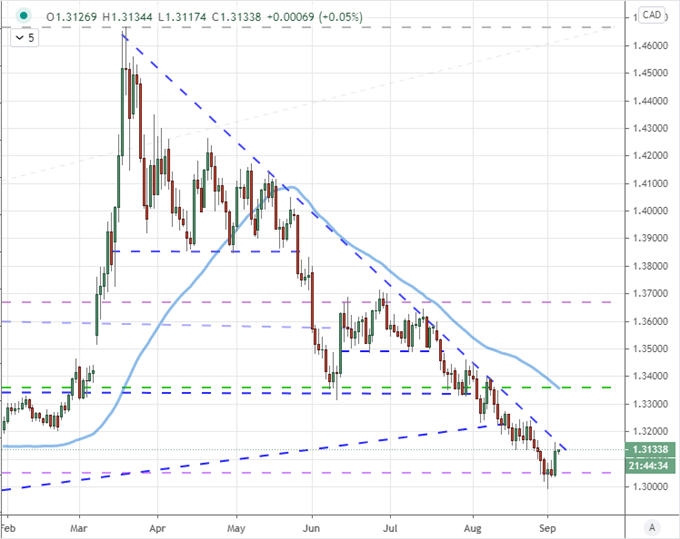
Chart Created on Tradingview Platform
Speaking of a Dollar based major, EURUSD once again has something to reflect in the course and intent of the global financial system. This benchmark exchange rate had the benefit of a generally weak Euro and the US Dollar’s typical role as a haven when volatility is at its zenith. And yet, it would not mark fresh progress lower on the day and instead hold up the channel carved out the past month-and-a-half. This is not just a statement on the quality of risk trends thus far, but it would also insinuate that seasonal liquidity is still a critical factor.

Chart of EURUSD with 50-Day Moving Average and COT Speculative Positioning (Daily)
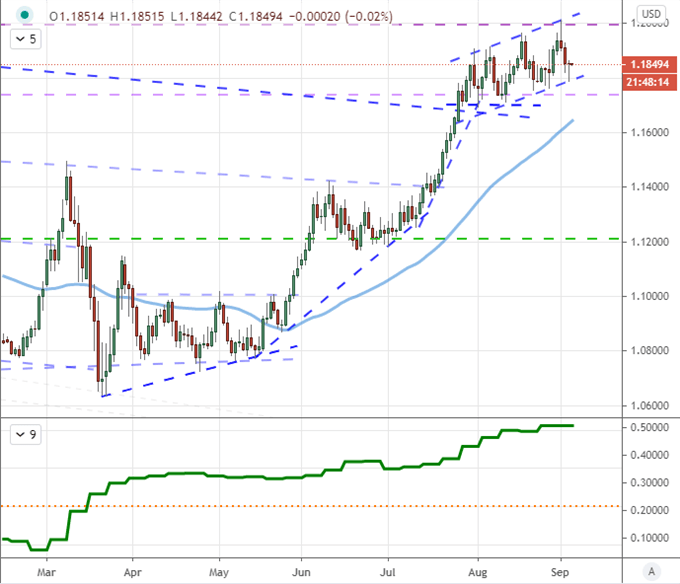
Chart Created on Tradingview Platform

If you want to download my Manic-Crisis calendar, you can find the updated file here.
.


