


Nasdaq, S&P 500, Dollar, Euro Talking Points:
- Despite the previous evening’s headlines reporting Tesla’s meeting the threshold for S&P 500 inclusion and Microsoft’s earnings beat, the Nasdaq dove Thursday
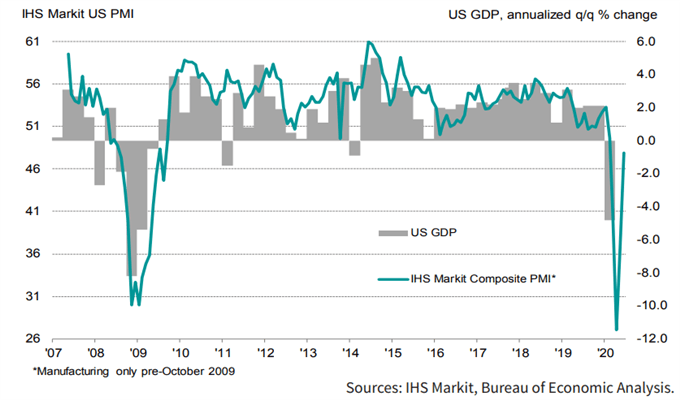
- While earnings will be a systemically important theme next week with COVID and trade war themes lurking in the background, Friday’s top risk seems GDP/recession related
- Where risk trends have signaled a provocative stall, the Dollar’s slide continued through Thursday for a fifth consecutive DXY drop that draws us very close to a key break
The Speculative Leaders for Risk Appetite – Tesla and Nasdaq - Stall
The risk appetite that had driven recent speculative favorites like Tesla to record highs hit a very overt skid this past session. Given the uneven performance of bullish interests as of late, this falter from the high-profile pace-setters raises much more significant concern over the lift behind the broader financial markets. Taking a closer look at TSLA through this past session, the company’s report of a fourth quarter of profitability set the stage for its inclusion in the vaunted S&P 500. Given weeks of outperformance for this ‘disruptor’, it would seem a straightforward spark for extension; but that didn’t prove the case Thursday. Not only did Tesla shares drop, but FAANG adjacent Microsoft slipped as did tech-heavy (and risk market pacing) Nasdaq 100. If favorable news can’t muster gains for the market’s favorite vehicles, it is important to be cautious.

Chart of Nasdaq with Tesla Overlaid in Purple and 1-Day Rate of Change (Daily)
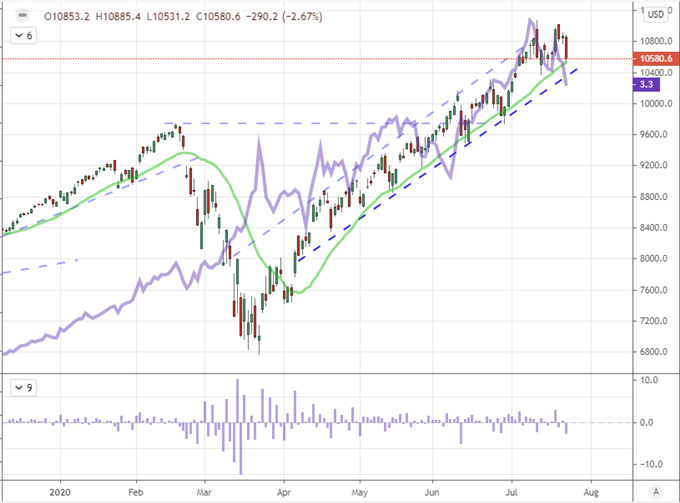
Chart Created on Tradingview Platform
Read Paul Robinson’s article on some of the most impressive bubbles in recent market history.
Looking a little further out from the absolute center of the market’s speculative focus, the S&P 500’s tentative break above six-week resistance around 3,230 faltered in a broader retreat. For the blue-chip Dow Index, the reversal seemed to fit more broadly into contained range. Looking for the fundamental thread that could pick up the lead on sentiment, earnings looks to face a gap until next week when FAANG members report on Wednesday and Thursday. Meanwhile, the tailwinds from the EU’s approval of a 750 billion euro stimulus program tapered off the day before and attention around the pandemic is still unmoored from the growing cases and deaths in the United States. Perhaps recession concerns and stimulus hopes will take up the reins.
| Change in | Longs | Shorts | OI |
| Daily | 1% | -1% | 0% |
| Weekly | 15% | -13% | -1% |
Chart of S&P 500 Overlaid with Crude Oil Overlay as Growth Measure in Blue (Daily)
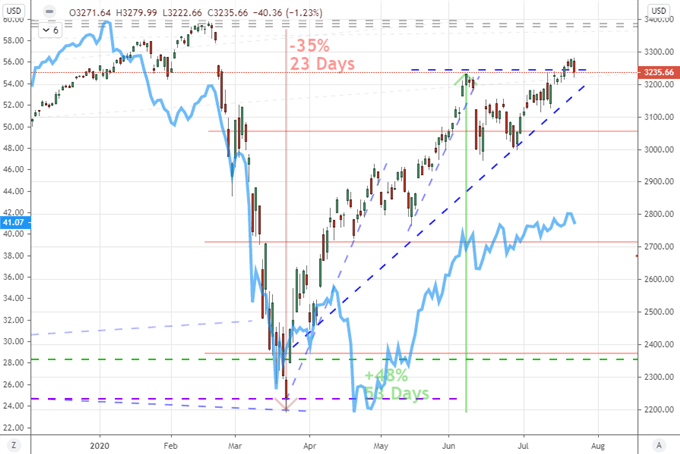
Chart Created on Tradingview Platform
Systemic Themes Shift Through Friday
A reference to a poll I conducted a over a week ago, traders seem to be placing greater emphasis on the influence of stimulus as a prop for market performance than they do anticipation of growth or returns. With central banks already flooding the system and loosely vowing to do whatever is necessary to top of the system should trouble arise, fiscal support looks like a mere top off. That said, skepticism has clearly gained traction these past weeks. Should the global economy pitch back into recession, it is very likely that any disjointed effort by major economies to fight back the gloom are ultimately deemed ‘insufficient’. On the other hand, where stimulus is unlikely to rouse a global groundswell, it can still spur speculative favoritism. In particular US authorities seem to be progressing on CARE 2 which could earn another temporary reprieve, but it is likely to do even more for the Dollar.
Twitter Poll of First Major Market to Break
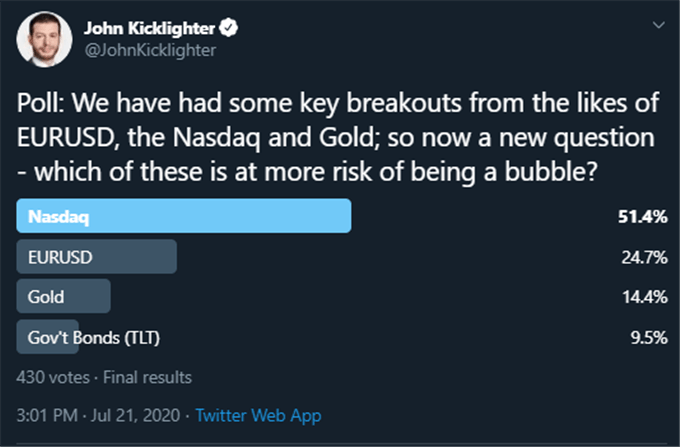
Poll from Twitter.com, @JohnKicklighter Handle
For a fundamental focus through this final session of the trading week, my attention will be firmly set on growth potential. Next week, there are a range of 2Q GDP figures due for release – from the United States to the Eurozone. This data hold inherent weight, but it is lagging and heavily benchmarked ahead of time. As such, I put more personal emphasis on the timely through more restricted measures like the PMIs. The monthly readings for Australia, Eurozone, UK and US are due Friday. I will be most focused on the US updates; but still put the potential for a systemic charge in the twilight hours of the week at ‘low’.
Keep Close Tabs on the Dollar – For Systemic and Trade Reasons
As risk trends lose traction and threaten to transition back into a path-of-least-resistance range reversion, I would note that the Dollar’s tumble has thus far contended unbroken. The Greenback has dropped five consecutive trading days which means EURUSD has advanced at the same pace. It is easy to conflate Dollar weakness with Euro strength; but the second most liquid currency hasn’t shown a tangible strength more broadly. If the Greenback is sliding under its own issues, the potential around US stimulus news and the local PMI figures for July should be monitored closely. With EURUSD closing on a range resistance of serious weight around 1.1750, the question of conviction – Dollar weakness and/or Euro strength – gains serious heft.
| Change in | Longs | Shorts | OI |
| Daily | -1% | -4% | -3% |
| Weekly | 4% | -10% | -5% |
Chart of EURUSD (Monthly)
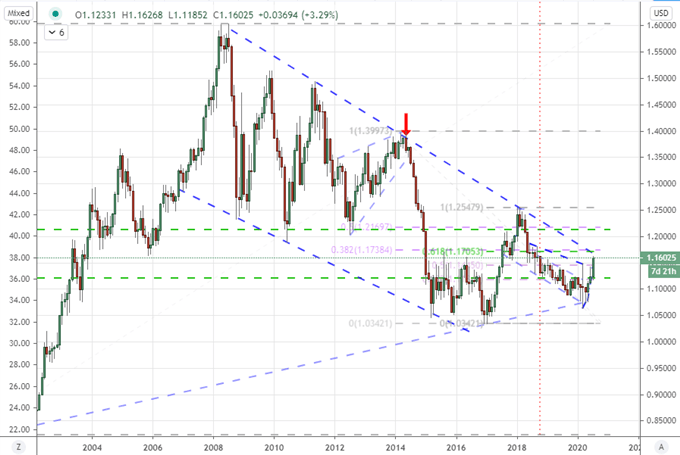
Chart Created on Tradingview Platform
Looking at the Dollar is relief, the benchmark currency has taken a remarkable hit this past week. The five-day drop is not a record setting slide for the DXY Index (the weekly drop of the same tally is a two-and-a-half year stretch), but it is starting to seriously pressure support dating back 9 years. What is particularly remarkable about the Dollar’s efforts is that it contrasts to the hesitation for indices and other risks assets. Is the Dollar playing the role of a safe haven, a deflated currency or something else? With EURUSD at multi-year resistance, Gold within reach of record highs and other pace setting milestones, it is worth gaining a bead on the currency.
Chart of DXY Dollar Index with Consecutive Candle Count (Weekly)
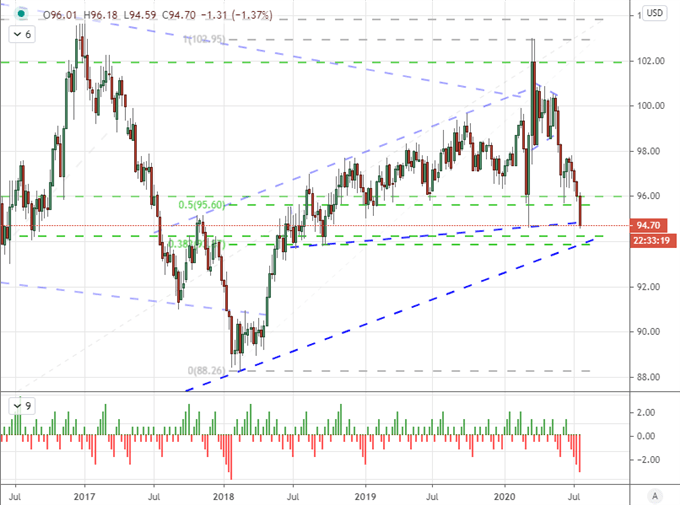
Chart Created on Tradingview Platform

If you want to download my Manic-Crisis calendar, you can find the updated file here.
.


