


S&P 500, Dollar, EURUSD Points:
- With the S&P 500 leading risk trends to the cusp of a critical technical breakdown, sentiment held the line with a notable bounce in favor of complacency
- Cases of coronavirus infections in the US have hit a record high which poses a sustained risk to broad risk trends and potentially even a Dollar-specific fear
- Financial concerns have swelled with the Fed’s bank stress tests restricting stock buybacks and the IMF’s stability report warning market shave disconnected from value
Risk Trends Refuse to Slip Confirm a Bearish Collapse
Heading into Thursday’s trading session, there was serious speculative question hanging in the air: would the prevalence of COVID headlines and warnings over the intensity of the global recession finally tip the S&P 500 and other risk-leaning benchmarks into a clear bear trend? Through Thursday’s close, we would find that though there was unmistakable concern throughout the system, the spark for a self-consuming sentiment move would not be struck. Though my preferred measure of conviction is the correlation across key sentiment assets, the broad US equity index remains a good superficial benchmark of its own. The 200-day moving average around 3,020 remains my next key line in the sand.
| Change in | Longs | Shorts | OI |
| Daily | 1% | -1% | 0% |
| Weekly | 15% | -13% | -1% |
Chart of the S&P 500 with 50 and 200-Day Moving Average and 50-Day Disparity (Daily Chart)
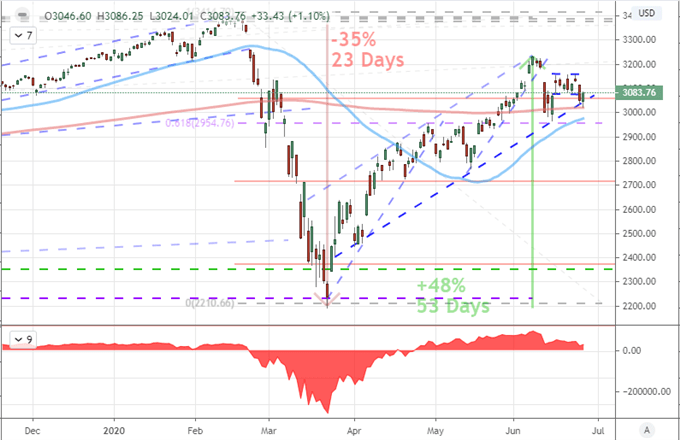
Chart Created on Tradingview Platform
With yet another critical tipping point threatened and avoided, I am reminded that market conditions continue to exert a material lack of conviction. This is true for a lack of commitment for unbridled risk appetite as much as it is for a systemic deleveraging. While direction is an important qualifier for those looking to place trend trades, the lack of conviction can lead to a market consideration of its own. When trends fail to exert themselves and breakouts cannot earn follow through, conditions naturally support congestion. In that spirit, I polled Twitter to see what time frame charts traders preferred. There was a clear skew towards shorter durations with ‘hourly and lower’ periodicity capturing the majority at 34 percent of the vote.
Twitter Poll Asking Participants Preferred Chart Time Frame
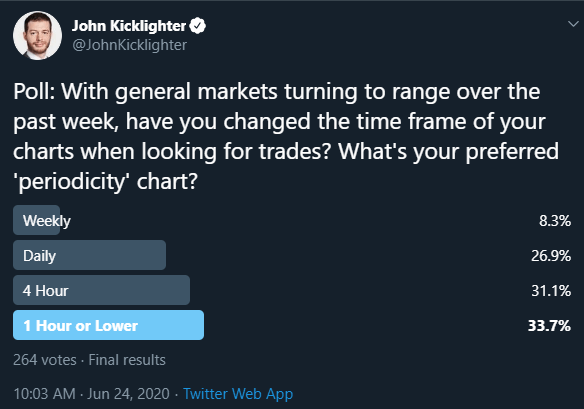
Poll from Twitter.com, @JohnKicklighter
Financial Warnings Go Unheeded
Despite the check higher in speculative assets this past session, the fundamentals continued to take a material slide in the opposite direction. Following on the back of Wednesday’s sharp downgrade in global growth forecasts from the IMF (from a -3.0 to -4.9 percent projected 2020 contraction), we were met with additional reminders of the economic hardship at hand. The US reported another 1.5 million claims for unemployment benefits this past week, building on a serious concern over the resurgence of coronavirus effects.
Table of Major Economies and Regions Growth Forecasts from IMF’s WEO
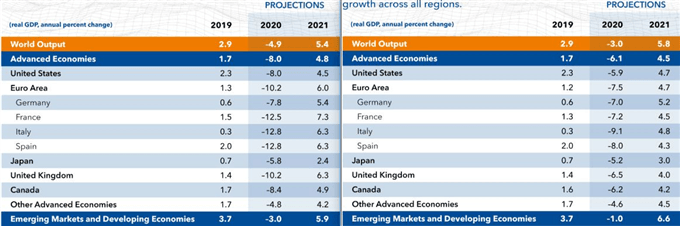
Tables from IMF
On the back of their growth forecast, the IMF released its Global Financial Stability report Thursday; and the results were far from encouraging. The most remarkable statement from their synopsis for me was “…a disconnect between financial markets and the evolution of the real economy has emerged, a vulnerability that could pose a threat to the recovery should investor risk appetite fade.” In essence, the collective moral hazard is a critical structure of our stability and stabilizing factors like central bank stimulus are increasingly vital our fragile backdrop. Speaking of stimulus, the Fed’s bank stress test didn’t unleash any restricted sense of enthusiasm. The authority announced the United States’ largest banks would have to cap dividends and halt buybacks through the third quarter with some participants to its evaluations facing risk should a ‘U-shaped’ or ‘W-shaped’ recovery take place for the economy.
Chart of S&P 500 Over ‘Risk-Reward’ Index (Daily)
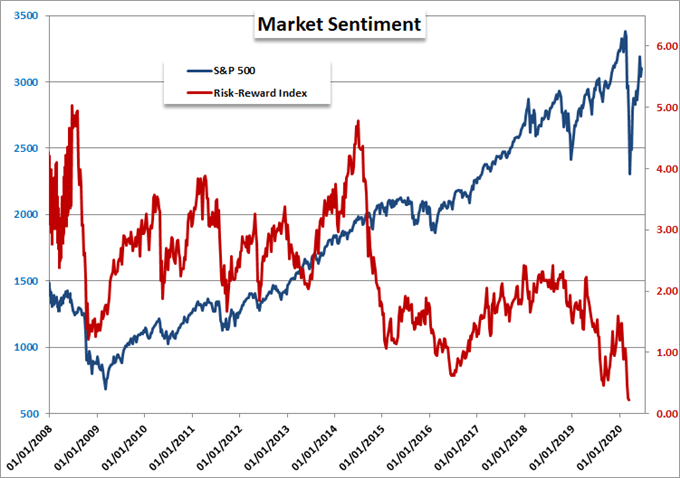
Chart Created by John Kicklighter with Data from Bloomberg
Another theme of systemic influence that has drawn more concern than repricing in the markets is the state of the pandemic. Globally, the cases of positive COVID-19 tests is just off a record high, but the headlines have focused in on the infections in the United States. The number of new cases in the US hit a record high through the 24th with a number of states reporting a significant increase in cases.
Graph of US Cases of Coronavirus (Daily)
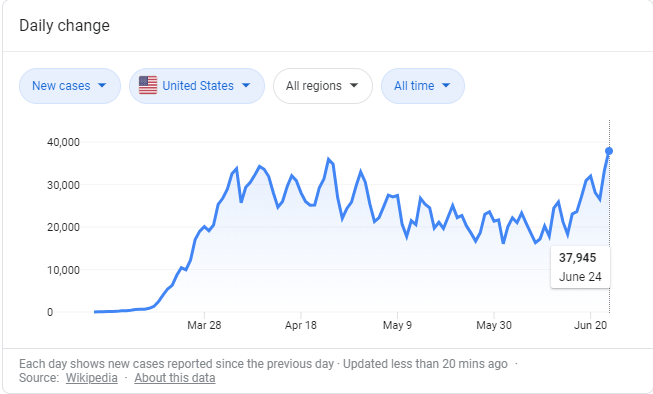
Chart from Google with Data from Wikipedia
What I’m Watching Through Friday’s Trading Session
Heading into the final trading session of the week, there are a few noteworthy pieces of scheduled event risk on tap. In particular, I will take account of the personal income and spending figures from the US. This is an important growth-related update from the largest collective force of growth in the world (the US consumer). That said, the most reasonable market-moving potential matter on my radar remains the focus on the pandemic. This past session, Texas – previously resistant to shutting down – suspended its reopening as the Governor warned hospitals were being overwhelmed. Even if the federal government has not intention of shutting down the economy a second tie, the local governments, businesses and American citizens will respond. In this vein, Apple (the world’s largest publicly-traded company) shut another 14 of its locations in Florida to bring the national tally up to 32.
Chart of Google Search Ranking for ‘Second Week’ (Weekly)
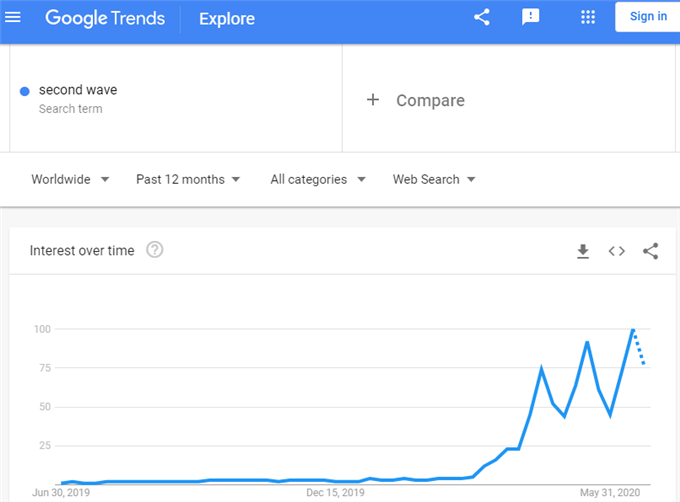
Chart Created on Google Trends
A second wave of the pandemic is a matter for global risk trends, but given the focus on the rise in cases in the United States specifically (at least in the headlines); there may also be a material impact on the Dollar and US assets relative to their global counterparts. Thus far, the Greenback maintains a strong negative relationship to risk assets like the S&P 500, but that may change if we continue to pass over on a clear risk trend. Mind EURUSD and the other Dollar majors through Friday and beyond.
Chart of EURUSD with 50-Day Moving Average (Daily)
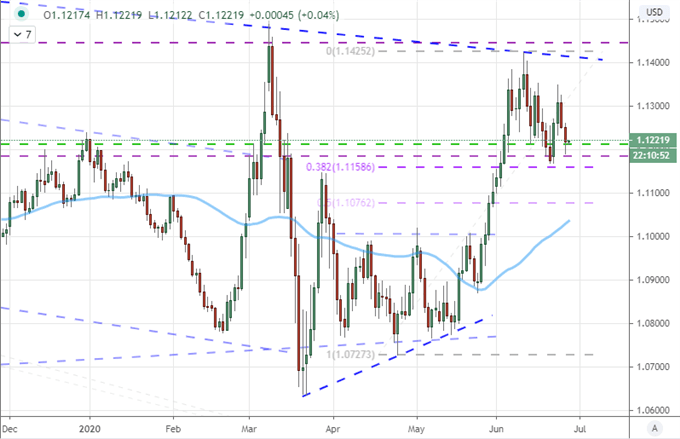
Chart Created on Tradingview Platform

If you want to download my Manic-Crisis calendar, you can find the updated file here.
.


